Download
1 / 21
210 likes | 325 Views
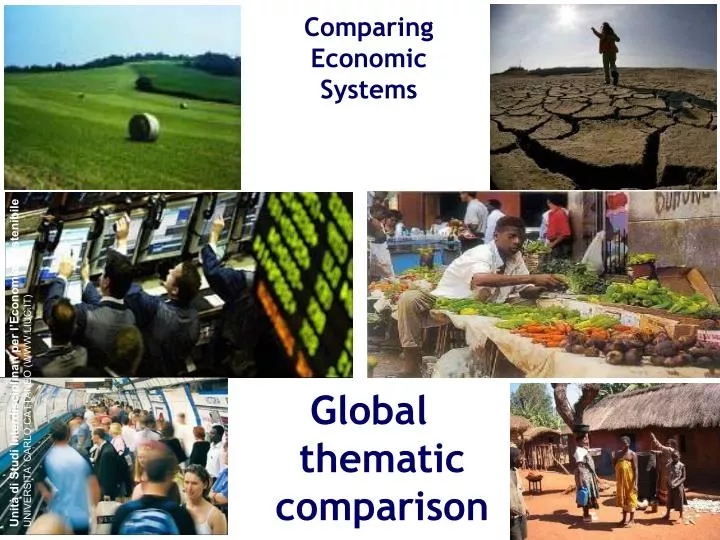
Comparing Economic Systems Global thematic comparison. Unità di Studi Interdisciplinari per l’Economia Sostenibile UNIVERSITA’ CARLO CATTANEO (WWW.LIUC.IT). Selected performance survey: GDP and other indicators.

E N D
Comparing Economic Systems Global thematic comparison Unità di Studi Interdisciplinari per l’Economia Sostenibile UNIVERSITA’ CARLO CATTANEO (WWW.LIUC.IT)
Selected performance survey: GDP and other indicators • This growing interest may reflect a combination of objective as well as societal factors. • A first one probably lies with the increasingly visibility of some of the adverse consequences of economic activity on the environment (e.g. climatic change). • A second factor is the end of the “catching up” period, the so-called “30 glorieuses”, where GDP growth was substantial. The period of lower and less regular economic growth that followed was accompanied by higher perceived economic insecurity, in the form of greater exposure to unemployment, poverty and bad work conditions. • Changes in goals necessarily go along with changes in indicators. • From a perspective of economic welfare, the main limits can be identified to this concept: • the exclusion of many household activities that are productive in an economic sense • the problems concerning the measurement of non market output and its aggregation with market production.
Gross Domestic Product (GDP) The GDP is a basic measure of a country's overall economic performance. It is the market value of all final goods and services made within the borders of a country in a year. • Product approach • GDP = Gross Value Added + Taxes on products - Subsidies on products Sales of goods - purchase of intermediate goods to produce the goods sold • Expenditure method • GDP = Consumption + Investment + Government Spending + (Exports-Imports). • Income method • GDP = Rents + interests + profits + statistical adjustments + wages 3
Gross national income (GNI) comprises the value of all products and services generated within a country in one year (i.e., its gross domestic product), together with its net income received from other countries (notably interest and dividends). The GNI consists of: the personal consumption expenditures, the gross private investment, the government consumption expenditures, the net income from assets abroad (net income receipts), and the gross exports of goods and services, after deducting two components: the gross imports of goods and services, and the indirect business taxes. The GNI is similar to the gross national product (GNP), except that in measuring the GNP one does not deduct the indirect business Gross National Income
GDP is the sum of gross value added by all resident producers in the economy plus any product taxes and minus any subsidies not included in the value of the products. GDP per capita (US$) First 20 Last 20 Source: World Bank, 2011
GDP growth (2000-2010) 7% and beyond Up to 2% Source: World Bank, 2011
GNI vs GDP GNP is a concept that goes hand in hand with GNI, GDP, and NNI. In contrast to the GNI, the GNP does not account for the balance of cross-country income, such as interest and dividends. In contrast to the GDP, the GNP account for the values of products and services based on citizenship of the owners rather than the territory of the activity Net national income (NNI) is an economics term used in national income accounting. It can be defined as the net national product (NNP) minus indirec taxes. Net national income encompasses the income of households, businesses, and the government. It can be expressed as:NNI = Consumption + Investment + Government spending + (Net eXports) + net foreign factor income - indirect taxes - depreciation For example, the profits of a US-owned company operating in the UK will only count towards US GNI and UK GDP. If a country becomes heavily indebted, and pays large amounts of interest to service this debt, this will be reflected in a decreased GNI but not a decreased GDP. If a country sells off its resources to entities outside their country this will also be reflected over time in decreased GNI, but not decreased GDP. Therefore, the GDP appears more attractive for countries with increasing national debt and decreasing assets. GNI vs GNP
PPP GNI is gross national income (GNI) converted to international dollars using purchasing power parity rates. GNI per capita (US$) First 20 Last 20 Source: World Bank, 2011
Gini coefficient, 2013 The Gini coefficient is a measure of the inequality of a distribution, a value of 0 expressing total equality and a value of 1 maximal inequality. Source: CIA Factbook 2013 (from World Bank data)
Income share held by lowest 20%, 2010 Source: World Bank, 2011
Income share held by highest 20%, 2010 Source: World Bank, 2011
The Human Development Index (HDI) is a composite statistic used to rank countries by level of "human development" and separate "very high human development", "high human development", "medium human development", and "low human development" countries. The Human Development Index (HDI) is a comparative measure of life expectancy, literacy, education and standards of living for countries worldwide. It is a standard means of measuring well-being, especially child welfare. It is used to distinguish whether the country is a developed, a developing or an under-developed country, and also to measure the impact of economic policies on quality of life. There are also HDI for states, cities, villages, etc. by local organizations or companies. Human Development Index (HDI)
Human Development Index (HDI) value, 2011 Source: United Nations Development Programme (UNDP), 2011
Human Development Index (HDI) trends: 1980 - 2011 First 20 countries Source: United Nations Development Programme (UNDP), 2011
Human Development Index (HDI) trends: 1980 - 2011 Last 20 countries Source: United Nations Development Programme (UNDP), 2011
Since 2004, the report ranks the world's nations according to the Global Competitiveness Index. The report states that it is based on the latest theoretical and empirical research. It is made up of over 110 variables, of which two thirds come from the Executive Opinion Survey, and one third comes from publicly available sources such as the United Nations. The variables are organized into twelve pillars, with each pillar representing an area considered as an important determinant of competitiveness. Global Competitiveness Index
Last 30 First 30
Big Mac Index Source: The Economist, 2011
Environmental Performance Index (EPI) The 2010 Environmental Performance Index (EPI) ranks 163 countries on 25 performance indicators tracked across ten policy categories covering both environmental public health and ecosystem vitality. These indicators provide a gauge at a national government scale of how close countries are to established environmental policy goals
EnvironmentalPerformance Index (EPI) 2012, selected countries Last 20 country First 20 country Source: Yale/CIESIN, 2013, 2012 Environmental Performance Index