Download
1 / 23
230 likes | 356 Views
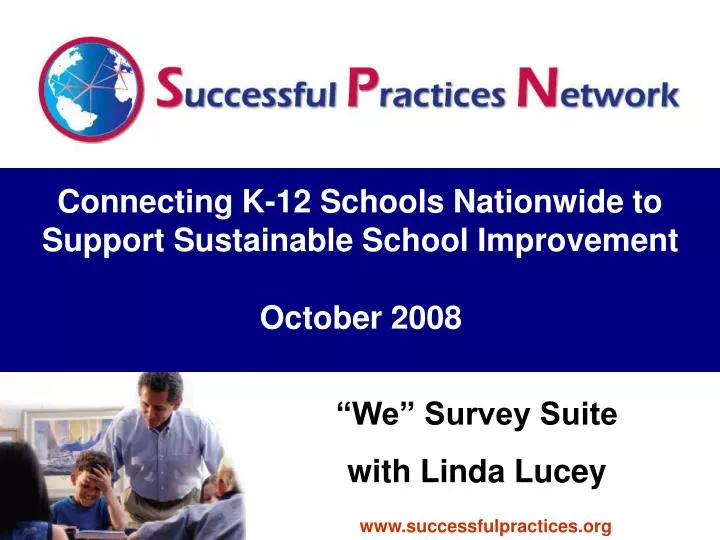
Connecting K-12 Schools Nationwide to Support Sustainable School Improvement. October 2008. “We” Survey Suite with Linda Lucey. www.successfulpractices.org.

E N D
Connecting K-12 Schools Nationwide to Support Sustainable School Improvement October 2008 “We” Survey Suite with Linda Lucey www.successfulpractices.org
Do you know what your students think about school?Do they think learning is fun and exciting?Do they feel challenged and supported?
Rigor • Relevance • Relationships • Leadership • Rigor • Relevance • Relationships • Leadership • Coherent Vision • Instructional Leadership • Empowerment Learn Student Survey Teach Instructional Staff Survey Lead Whole Staff Survey www.successfulpractices.org
Learn • Grades 6-12 students • 60 item survey • Rigor, Relevance, Relationships & Leadership • Select items parallel We Lead and We Teach
Sample Data:We Learn Student Survey Grades 6-12 66% If I were given more challenging work in class I would do it. 83% When I struggle in class I receive the support I need to be successful. 76% What I learn in school will help me in the future. 58% We do lots of hands-on activities in my class. 78% Teachers respect each other. 51% I have lots of friends at school. 35% I know the goals my school is working on this year. 45% My ideas are important to my teachers when they plan lessons. rigor relevance relationships leadership
Teach • K-12 Instructional staff • 60 item survey • Rigor, Relevance, Relationships & Leadership • Select items parallel We Lead and We Learn
Sample Data:We Teach Instructional Staff Survey Grades K-12 66% This school has high expectations for all students. 83% In my class students discuss and solve open- ended questions and problems. 76% I make learning exciting for my students. 58% Instruction in my class is student-centered. 78% Staff respect each other. 31% My colleagues are a source of encouragement for me. 87% The school administration clearly communicates the goals of the school to staff. 65% New ideas are considered essential by administration in this school. rigor relevance relationships leadership
Sample Data:We Teach/We Learn Comparisons Rigor T=85% S=65% In class, we discuss and solve open-ended questionsand problems. Relevance T=76% S=54% Teachers use a variety of instructional strategies to help students learn. Relationships I am aware of my students’ interests outside of school T=61% My teachers know my interests outside of school. S=42%
Sample Data:We Teach/We Learn Comparisons Leadership I know my school’s mission/vision. My day-to-day actions are aligned with the mission andvision of this school. S=45% T=78%
The Report • Emailed to main contact within 2-3 weeks of completion • Demographic information • Items disaggregated by gender and grade level (Student Survey) • Items disaggregated by role in school (Instructional Staff Survey) • Rigor, Relevance, Relationships, Leadership Item Analysis • All statements and responses by percentage
The Elements of Rigor, Relevance, Relationships and Leadership • Continue by studying the data reported for rigor, relevance, relationships and leadership. The report is organized around each of these elements so that can be explored individually. • Look for connections among related items that warrant deeper discussion. • Note areas of strength and celebrate them! Look for and share with staff, students and stakeholders the perceived strengths of the school. • Note areas of concern, and then take steps to understand what those data indicate and how to make improvements.
Questions? Learn Student Survey Teach Instructional Staff Survey
60 item Whole Staff Survey • Coherent Vision • Instructional Leadership • Empowerment • Goal Focus • Decision Based on Reliable Data • Curriculum and Instruction • Professional Development • Fidelity of Implementation • Trust • Communication • Relationships
Coherent Vision Goal Focus Decision Making Academy Data (n=4,462) AllSTATEMENT 91% My day-to-day actions are aligned with the mission and vision of this school. 73% Decisions at this school are based on the needs of students. 75% Adults in this building work together effectively to achieve this school’s goals. 72% I am provided with the opportunity to be involved in this school’s improvement planning. 62% The school’s mission and vision are reviewed on a regular basis with the staff. 57% Staff morale at this school is high. 71% Community expectations are understood and respected by the school staff. 94% My professional objectives are aligned to student achievement.
Instructional Leadership • Curriculum and Instruction • Professional Development • Implementation
Academy Data Curriculum and Instruction Professional Development Implementation Instructional Leadership AllSTATEMENT 95% I solve problems effectively. 52% School administrators implement change without undue stress. 62% Changes in curriculum and instructional practices are coordinated districtwide. 61% I take an active role in curriculum planning at this school. 90% The school environment supports learning. 63% I am supported when I recommend changes to my curriculum and instruction. 93% Staff are expected to adapt their practices to meet the needs of all students. 77% Continuous improvement is driven by school administration. 64% School administrators solve problems effectively. 25% Staff are resistant to new ideas. 97% I am open to new ideas.
Empowerment • Trust • Communication • Relationships
Trust Communication Relationships Empowerment Academy Data AllSTATEMENT 74% There is strong communication between school administration and staff. 53% Poor staff performance is not tolerated at this school. 65% The right people are in leadership roles at this school. 56% School administrators see me as a leader. 60% I have adequate opportunities to contribute to schoolwide decisions. 64% The school administration creates a climate of trust. 90% I am proud of this school. 90% I have clearly defined objectives that meet the needs of students. 86% I see myself as a leader. 27% I have input in districtwide policies. 25% Administrative procedures interfere with my job. 72% I trust my colleagues will act in my best interest. 68% I trust that school administrators will act in my best interest.
Academy Data Discrepancies Decisions at this school are based on the needs of students. 73% My professional objectives are aligned to student achievement. 94% I solve problems effectively. 95% School administrators solve problems effectively. 64% School administration is resistant to new ideas. 15% Staff are resistant to new ideas. 25% I am open to new ideas. 97% School administrators implement change without undue stress. 52% Continuous improvement is driven by school administration. 77% School administrators see me as a leader. 56% I see myself as a leader. 87%
Academy Data Similarities Changes in curriculum and instructional practices are coordinated districtwide. 62% I take an active role in curriculum planning at this school. 61% I am supported when I recommend changes to my curriculum and instruction. 63% I trust my colleagues will act in my best interest. 72% I trust that school administrators will act in my best interest. 68%
The Standard Reports An Enhanced Report • We Learn – Gender and grade level • We Teach – Role in school • Classroom Teachers, Instructional Support Staff • We Lead – Role in school • Full-time dept. chair, classroom teacher, support staff • $100 per additional variable
We Lead Survey $600 Whole StaffWe Teach Survey $600 Instructional StaffWe Learn Survey $1,100 (500 Students) ($1/each additional) Sponsored Research For More Information Jackie Gonyo jackie@spnet.us 518-723-2047 Discounted for SPNetwork Members