Download
1 / 18
180 likes | 270 Views
Investigating the Impacts of Illegal Immigration. Presented by: Joshua R. Brownstein, Associate Economist Christopher S. Gerlach, Associate Economist May 27, 2010. Outline. State of Affairs. 31.1 million foreign-born population in 2000 (19.8 M in 1990)

E N D
Investigating the Impacts of Illegal Immigration Presented by: Joshua R. Brownstein, Associate Economist Christopher S. Gerlach, Associate Economist May 27, 2010
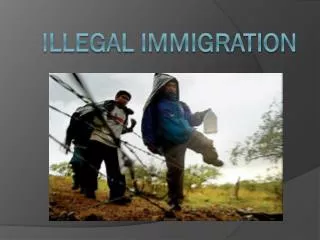
State of Affairs • 31.1 million foreign-born population in 2000 (19.8 M in 1990) • Immigrants (legal permanent residents) • Temporary migrants (e.g. students) • Humanitarian migrants (e.g. refugees) • Unauthorized migrants (people illegally residing in the U.S. – includes those w/ expired visas) • California, New York, Texas, Florida, Illinois and New Jersey account for more than two-thirds (21.3 M) (U.S. Census Bureau, 2000) • 8.3 million illegal immigrants working in the U.S. as of March 2008 (Pew Hispanic Center, April 2009) • Demographic characteristics of undocumented immigrants: • Adult males • Less-educated • Employed in low-paying jobs (service occupations, construction, food preparation, farming, etc.)
Legislation and Controversy • Historical Proposed Federal Legislation • 2004 Guest Worker Program (President G.W. Bush) • 2005 Comprehensive Enforcement & Immigration Reform Act (S. 1438) • 2006 Comprehensive Immigration Reform Act (S. 2611) • 2007 Comprehensive Immigration Reform Act (S. 1348) • Arizona Senate Bill (SB 1070) • Mandates that law enforcement officials determine immigration status at the time of a lawful stop if there is reasonable cause to do so • Makes it a misdemeanor to not carry immigration papers • Allows legal residents to sue relevant state agencies for non-compliance • Controversy • Illegal immigrants are taking jobs away from legal residents, driving down wages, using public services without contributing taxes, committing crimes and overcrowding prisons … Federal Government has been unwilling/unable to effectively address this issue … • Tantamount to state-sanctioned racial profiling … loss of cooperation from immigrant community … drastic increase in short-term incarceration rates/costs … likely to shift rather than curtail the flow of illegal immigration …
Modeling Considerations • What specific form does the legislation take? • Enforcement … proactive and/or reactive • Legalization … existing and/or new • National vs. regional • What are the comprehensive impacts of immigrants? • Legal … proxy for potential impact of legalization policies • Illegal … specific characteristics of the underground economy • What is the appropriate time-frame of analysis? • Inclusion of descendants … e.g. long-term costs/benefits of public education • Potential lags in labor market responses may lead to fiscal microeconomic insolvency • What is the appropriate scope of analysis? • Fiscal vs. economic • Regional vs. national … high disparity across regions … impacts more severe at local levels • Other considerations … • Student visas … higher education as an export and driver of regional/national competitiveness • Travel and tourism … boycotts
Texas Comptroller Analysis Overview December 2006 study by the Texas Office of the Comptroller of Public Accounts measuring the impact of 1.4 million undocumented immigrants on the Texas economy • Fiscal Impact State Costs Education $967.8 million Health Care $ 58.0 million Incarceration $130.6 million TOTAL COSTS $1,156.4 million State Revenues Consumption taxes and fees $866.7 million School property tax $582.1 million Etc. … TOTAL REVENUES $1,581.1 million • Economic Impact … contributions to major economic indicators from 2005 - 2025 Net Fiscal Impact to State: +424.7 M
Basic Methodology Scenario: Large Scale Ejection of Undocumented Immigrants • Economic Variables • Industry Employment (by sector) • Farm Employment • Exogenous Final Demand (by sector) • State and Local Government Spending • Compensation Rate / Non-Compensation Labor Costs • Production Cost • Labor Access Index • Capital Cost • Demographic Variables • Economic Migration • (Labor Force) Participation Rate • Prison Population • Alternative Model Specification
REMI Inputs • Regional Configuration • BEA 8-Region; 169-Sector national model • Baseline Recalibration • Alternative model specification: “turn off” REMI Economic Migration Response to Expected Income • Scenario • Industry Employment (share) • Construction • Services to Buildings and Dwellings (janitorial and landscaping) • Accommodation (housekeeping) • Food Services and Drinking Places (food preparation) • Economic Migrants (number) • Hispanic, Ages 0-64
Partial Model Demo Abbreviated Model Demonstration
Sample Results Decreased employment in undocumented immigrant-dominated industries … Decreased economic migration for Hispanic population/labor force … • Increase in average annual compensation rates (labor demand > labor supply) … • Decrease in regional competitiveness … • Decrease in regional exports … • Decrease in real disposable income (employment loss > compensation gain) … • Decrease in consumption … • Decrease in GRP … • Further decrease in Employment …
Take Aways • Immigration reform policies are exceedingly complex and will have a wide range of unique fiscal and economic implications depending on how they are implemented • Appropriate modeling of a comprehensive immigration policy will rely on a nuanced understanding of that policy’s intended behavioral responses • The temporal and geographic aspects of the policy and the analysis are crucial to deriving justifiable output The REMI model is an effective way of standardizing this type of analysis and can be a persuasive tool for informing policy makers of the likely consequences of any given legislation
Questions/Comments? District Office: 700 12th St. NW, Suite 700 Washington, DC 20005 Ph: 202.904.2490 josh@remi.com chris.gerlach@remi.com www.remi.com Joshua R. Brownstein Associate Economist Christopher S. Gerlach Associate Economist
TX Study Fiscal Detail • Costs of illegal immigrants (state costs only ... local effects may be greater) • Education (primary and secondary) • ~135,000 undocumented students in TX public schools • ~$7,000 / student / year (excluding federal funds) • ~$957 million • ~$11 million (higher education) • Medical expenses ~$58 M • Emergency Medicaid • State and Local Programs (children with special health care needs, substance abuse services, mental health services, immunizations, school-based programs • Public Health Programs • Incarceration ~$130 M • Law enforcement • Trials and appeals • Corrections • Impact on wages of legal residents • Revenues from illegal immigrants • Sales tax • User taxes (gasoline, etc)
TX Study Fiscal Detail (cont.) • Contributions to employment, wages and revenues (2005-2025) • Contribution to state revenues ~$1,581 M ($999M + $582M) • Consumption taxes and fees • Sales tax • Motor vehicle sales and use tax • Gasoline tax • Alcoholic beverage taxes • Cigarette and tobacco taxes • Hotel tax • Lottery proceeds • Utility taxes (gas, electric, water) • Court fees • All other revenues (higher education tuition, state park fees • Local school property taxes ~$582 M
Cato Analysis • Direct Employment (foregone/gained) Personal income Consumption Output • Compensation Rates (immigrants/U.S. residents) Production costs Imports/Exports Output • Fiscal Impact (expenditures/revenues) • Services: Public education, health care, incarceration • Taxes: Income, property, consumption, visa • Descendant Impact (short-term/long-term) • Educational attainment • Income Consumption Output • Productivity Production Costs Output