Download
1 / 2
20 likes | 87 Views
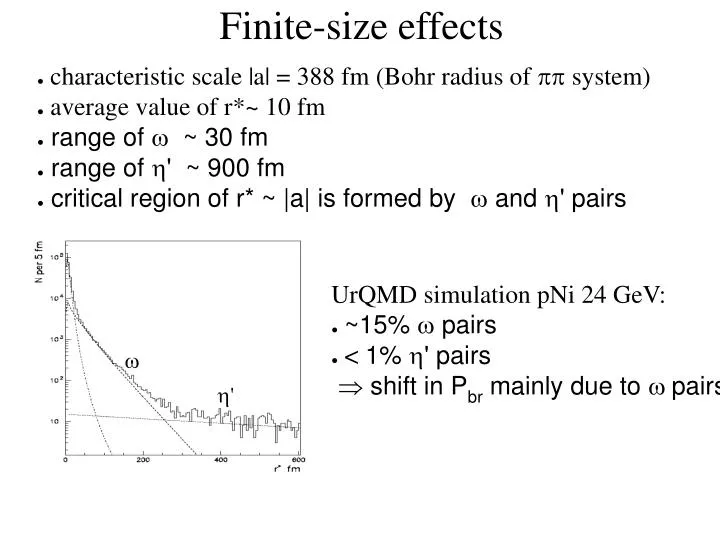
Finite-size effects. characteristic scale |a| = 388 fm (Bohr radius of pp system) average value of r*~ 10 fm range of ~ 30 fm range of ' ~ 900 fm critical region of r* ~ |a| is formed by and ' pairs. UrQMD simulation pNi 24 GeV: ~15% pairs < 1% ' pairs

E N D
Finite-size effects • characteristic scale |a| = 388 fm (Bohr radius of pp system) • average value of r*~ 10 fm • range of ~ 30 fm • range of ' ~ 900 fm • critical region of r* ~ |a| is formed by and ' pairs UrQMD simulation pNi 24 GeV: • ~15% pairs • < 1% ' pairs shift in Pbr mainly due to pairs '
Finite-size effects Simulation compared with DIRAC p-p-CF • simulation Nw = 19.2% (for p-p- pairs) • fit result Nw = 21±7% Þ good description of pairs by UrQMD Finite-size effect induces shift in Pbr • according UrQMD simulation Nw = 15% ÞdPbr ~ 2% Þdt ~ 5% • upper limit at 1 sigma of p-p- fit Nw = 20% ÞdPbr ~ 3% Þdt ~ 7.5% Þ Systematic uncertainty in t measurement from finite-size effect < 10% i.e. less then present DIRAC statistical error in t. Expected shift with multi-layer target in future DIRAC 5 times less