Download
1 / 50
650 likes | 974 Views
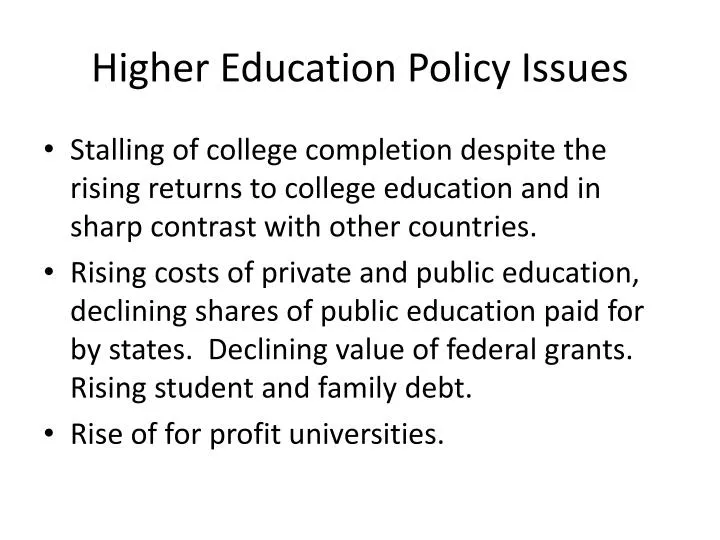
Higher Education Policy Issues. Stalling of college completion despite the rising returns to college education and in sharp contrast with other countries.

E N D
Higher Education Policy Issues • Stalling of college completion despite the rising returns to college education and in sharp contrast with other countries. • Rising costs of private and public education, declining shares of public education paid for by states. Declining value of federal grants. Rising student and family debt. • Rise of for profit universities.
Other Issues • Affirmative action and race based admissions at selective colleges and universities. • Grutter v Bollinger 2003 • Do students learn anything in college? • The Dream Act and access to higher education for undocumented immigrants. • Balance of research and teaching at large universities. • Decline of full time tenure track professors and rise of adjuncts.
American Higher Education Landscape • Types of Institutions • 2 year, 4 year • Public, Private, For Profit • Brick and Mortar, On Line • Types of Students • Traditional • Non traditional
Our world is unusual • 3.5% of undergraduates in the US attend private 4 year research intensive and liberal arts institutions.
46% 11% 18% 3.5% 9.2% 9.8% 2.9%
Types of Undergraduates • The “traditional undergraduate” makes up 27% of all undergraduates. • Enrolls full time in college immediately after graduating from high school. • Relies on parents for financial support • Does not work during school year or works only part time. • 28% are “highly non traditional” • In their late 20s or older. • Working while going to school • Parent of a dependent child.
Image and Reality of College Students • Among students in four year colleges, 45% work more than 20 hours a week. • Among those attending community colleges 60% work more than 20 hours a week, and more than a quarter work more than 35 hours a week. • 23% of college students have dependent children.
College enrollment by race among those age 18-24 • Whites 44% • Blacks 32% • Hispanics 25%
Income Total income in 2006 of independent students or the parents of dependent students.
History of Community Colleges • 1901, Joliet Community College was formed. Joint project by the University of Chicago and Joliet High School. Designed to expand educational opportunity and to prepare the very best students for the senior college at the University. • 1947 Truman Report, recommended that community colleges expand nationally to provide universal access to postsecondary education. • 1960s opening of 497 colleges.
Community Colleges • There is a community college within a short commute of 90% of the US population. • Curriculum often tied to the local area. • Napa Valley—wine growing. • Gulf Coast—petrochemical technician • Alabama—paper technology
Community Colleges • 1,165 open admissions community colleges enroll 46% of all US undergraduates • Half of all students who eventually earn a BA attend community college in course of study. • Full Time Full Year Community College student average cost $2,544. • In the last 5 years enrollment increased 25% • Over 60% of students require remedial education.
Workforce Development • They prepare over 50% of RNs, and the majority of other health care workers. • 80% of first responders with postsecondary credentials. • Through 2018, nearly 2/3 of all new jobs will require more than a high school diploma, nearly half of those will require some college but less than a BA.
American Model Spreading • Community colleges based on American model have been established in Saudi Arabia, Qatar, Vietnam, Thailand, and the Republic of Georgia. • Current discussions and exchanges with the UK, Australia, New Zealand, China, UAR, India, South Africa and Ukraine.
Obama Administration • Called on Community Colleges to increase the number of graduates and program completers by 5 million students over a 10 year period, a 50% increase over current numbers. • Health Care and Education Affordability and Reconciliation Act March 2010. Provides $2 billion for the Community College and Career Training Grant Program
Rise of the For Profit Sector • 30 years ago for profit colleges were small mom and pop type operations that taught skills for high demand jobs in business and health care. • Most students were working class adults working full time and wanting to upgrade their skills.
For Profit Colleges • 3,000 career colleges • University of Phoenix enrolls 455,600 students • 13 large publicly traded companies. • 2009 earnings $26 billion • They serve non traditional students, and students from low income backgrounds. • They have grown very fast since 1990.
In 1990 only 10% of for profit institutions offered associate, bachelors or professional degrees. 50% do now. • More than 90% of students at for profit institutions are now enrolled in degree programs. Only 30% go part time. • Increasingly they are enrolling people who have been turned away by budget strapped public institutions.
Title IV eligibility • Institutions must be “Title IV eligible” in order for students to receive Pell Grants and federal student loans • Granted by the Department of Education • Accredited by one of the approved accrediting agencies • Registered by one of the states • Meet standards on a continuing basis • Prior to 1998 an institution could not have more than half of its enrollment in distance education. Regulatory change—waivers. Growth of dedicated on line institutions.
For Profit Shares • For profits produce 18% of all associate degrees • 33% of all AAs in business, management and marketing • 51% in computer science and marketing • 23% in health professions • 34% in security and protective services • 2.4% in liberal arts
Source: Deming, Goldin and Katz, (2011) http://www.nber.org/papers/w17710
Federal Student Aid • Accounted for 73.7% of the revenues of Title IV eligible for profits in 2008-2009. • By law no more than 90% of revenue can come from federal student aid. Most of the chains are very close to 90% level. • Military aid to veterans and active duty military do not count towards the limits. (Hence the very active recruitment of military)
Federal Student Aid • For profits are much more expensive than non profits. • They account for 12% of students, but 24% of Pell grant disbursements and 26% of federal student loan disbursements. • Half of all students at for profits received Pell grants, compared to 25% at public and non profit institutions combined.
Default rates • An institution loses Title IV eligibility if its two year cohort default rate exceeds 25% for three consecutive years or 40% in one year. • Two year rates Three year rates • For Profits 11.6% 24.9% • Public 6% 10.8% • Private non profit 4% 7.6% • For profit students overall account for 47% of default rates on federal loans.
Student Outcomes • Larger debt burdens • Much higher default on student loans • Poorer employment outcomes • Less satisfaction with course of study • BUT, they also attract poorer students, more non traditional students with less preparation.
Student Outcomes • Propensity score matching and OLS regression controls for demographic characteristics show significant negative effects for attending a for profit. • Six years after starting college, for profit students are more likely to be unemployed, and to have longer unemployment spells. • They also have lower earnings.
Addressing high default rates • New Gainful Employment regulations (2011) • In order to stay Title IV eligible must do ONE of following: • At least 35% of former students must repay their loans (reducing their loan by at least $1 dollar per year) • Annual loan payments must not exceed 30% of a typical students total discretionary income • Annual loan payments not exceeding 12% of a typical students earnings.
Compared to Community Colleges • Disproportionately single parents, have much lower family income, are almost twice as likely to have a GED.
Income of Undergraduates who attend Private 4 year vs. For Profit colleges
University of Phoenix • 25,100 students in 1995. Now has 455,600. • 200 campuses in 39 states, Canada, Mexico, the Netherlands and Puerto Rico. • Most growth in people who study online. • Six year graduation rate: 9%
Success of For Profits • Hire professors by the course. Pay by the student not by the course. • Online courses. • Schedules that fit students lives. (block schedules, nights, weekends, online courses that can be accessed anytime). • They don’t turn away students when classes are full, they just add classes. • Decisions are made by executives, not faculty committees. Abolishing unpopular courses and majors and adding new ones can happen very quickly.
Cutting Costs • Faculty—American Military University • 140 full time faculty members and instructional designers design the courses • Faculty do not design courses, but are hired to teach them. Paid $130 per student, with a maximum per course of $2500. • Real Estate—De Vry • Reduce square foot per student (30-50) • Books—Phoenix • Students pay 75.00 per semester for access to online textbooks. Those are the only books used.
Success of For Profits • Large marketing budgets. • Large recruiting staff • Once students are enrolled, for-profit institutions work hard to hold on to them. Phoenix has what it calls an "early alert" system. If a student is absent or struggling in class, the student's professor contacts one of three counselors who are part of the student's "graduation team": an enrollment counselor, who helps choose and plot out students' program of study; an academic counselor, who works with them on any classroom difficulties; and a financial counselor, who helps them complete student-aid applications and sort out financial concerns.
Average Costs • For Profit Colleges $14,174. • Public 2 year $ 2,544. • Public 4 year $ 7,020
Median Debt for Graduates • Nonprofit private colleges $17,040 • Public colleges $7,960. • For profit colleges $17,040
Enrollment and Graduation at all institutions • While college enrollment has increased since 1980, college degree attainment has not changed. • The US has dropped relative to most other industrialized nations. • 22% of students from the lowest quintile attend college, 6% graduate.
Enrolling in College has increased.Graduating from college has not. • More than 80% of high school graduates go to college within 8 years of graduation. • The median 6 year graduation rate for four year colleges in 2008 was 53%. • The 6 year graduation rate at 4 year for profit colleges was 22%. • 20% of first time students at public community colleges get a degree or certificate in three years. • For profit two year programs have higher graduation rates of 66%.
What predicts college graduation? • Entering college immediately after finishing high school. • Taking a high school curriculum that stresses reading at grade level and math beyond basic algebra. • Higher socioeconomic status is also a predictor, but only moderately so.
Leaving College • The stress of working and balancing school. • Inadequate preparation. • Remedial education • 42% of freshman at community colleges • 12-24% of freshman at private and public 4 year institutions. • Students taking remedial education are much less likely to ever finish college. • Vocational success—finding jobs. • The degree of integration into the institution.
Solutions • Flexible scheduling • Online courses • Night and weekend courses • “Drop in” courses that cover the same material on different days and times. • Block scheduling • Making transfers between colleges work.
Less funding for Community CollegesCalifornia for example • Community colleges receive less than half the funding per full time enrolled student as the state colleges. • Community colleges receive less than one fifth of the funding per full time enrolled students as students in the University of California.
Student Advising • Students who need the most advising tend to get the least. • Counselor to student ratios at community colleges 1 to 1,000. • A national survey of entering community college students found that 32% did not attend a freshman orientation program and half did not meet with or recall seeing an academic advisor during their first four weeks of college.
Advising does matter • Better advising, courses on college study skills and time management leads to small but significant increases in persistence in college (randomized experiments). • This works much better for traditional students than non traditional students. • Aid for families filling out the FAFSA forms made a substantial difference in enrollments.
Solutions? • Learning Communities • MDRC “Opening Doors” • Increase integration among students and between students and faculty. • Remedial Education Laboratories • “Success Centers” with individualized tutoring, study groups and computer tutorials.
Policy Solutions? • Pay for performance for universities. Allocate money based on graduation rates. • Separate core education functions from all the other trappings of college education—sports, dormitories, meal plans etc. • Australia and New Zealand: income related loans. Former students repay debt based on their future incomes.