Download
1 / 8
80 likes | 196 Views
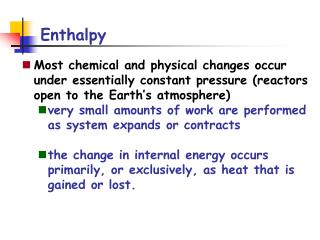
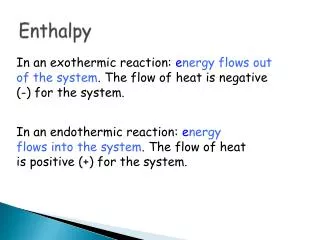
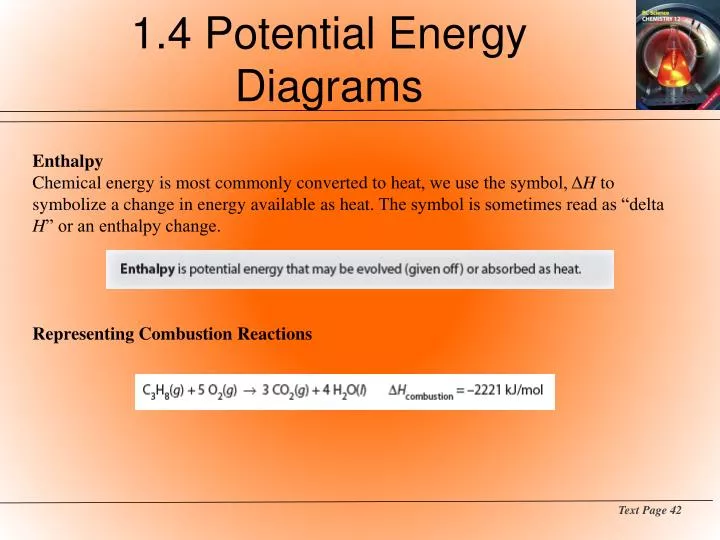
1.4 Potential Energy Diagrams. Enthalpy C hemical energy is most commonly converted to heat, we use the symbol, Δ H to symbolize a change in energy available as heat . The symbol is sometimes read as “delta H ” or an enthalpy change . Representing Combustion Reactions Text Page 42.

E N D
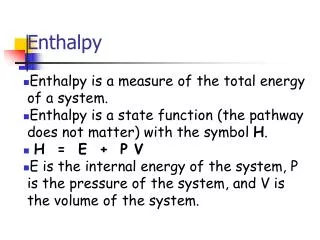
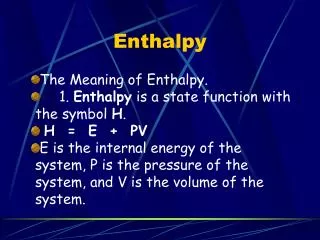
1.4 Potential Energy Diagrams Enthalpy Chemical energy is most commonly converted to heat, we use the symbol, ΔH to symbolize a change in energy available as heat. The symbol is sometimes read as “delta H” or an enthalpy change. Representing Combustion Reactions Text Page 42
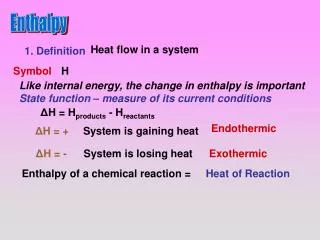
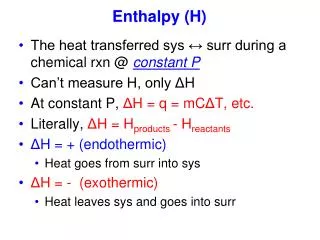
1.4 Potential Energy DiagramsEnergy of Chemical Bonds Bond Energy Endothermic Exothermic Representing the ΔH value associated with a chemical reaction. Text Page 43
1.4 Potential Energy DiagramsTransition State Theory Activated Complex An intermediate state that is formed during the conversion of reactants into products. The activated complex forms when potential energy is at a maximum and kinetic energy is minimized during a reaction. Text Page 44
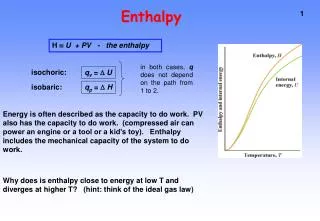
1.4 Potential Energy DiagramsPotential Energy Profiles Potential Energy Diagram graphical representation of the energy changes that take place during a chemical reaction. The enthalpy changes can be followed along the vertical axis, which measures potential energy in kJ/mol. The horizontal axis is called by a variety of names such as the “reaction coordinate” or the “progress of reaction.” It is critical to remember it is not a time axis. . Text Page 45
1.4 Potential Energy DiagramsPotential Energy Profiles - 2 Potential Energy Diagram (con’t) It is important to be aware that the net energy evolved or absorbed during the reaction is independent of the activation energy. Enthalpy Change While altering factors such as concentration, surface area, or temperature will affect the rate of a chemical reaction, they will not affect the appearance of a potential energy Diagram. Text Page 45
1.4 Potential Energy DiagramsReversible Reactions Many chemical reactions are reversible under certain conditions. Text Pages 47 - 48
1.4 Potential Energy DiagramsReversible Reactions - 2 • Summary • ΔH for the forward and reverse reactions have the same magnitude and opposite signs. • Eais always smaller for the endothermic reaction. • Altering temperature, pressure, concentration, or surface area will have no effect on a potential energy diagram. There is only one thing that will alter a diagram and that is discussed below. • Text Page 48
1.4 Potential Energy DiagramsActivation Energy and Catalysis Catalysts Potential Energy Profiles and Catalysts Text Page 49