Download
1 / 22
220 likes | 223 Views
Learn about the alarming obesity rates in California and the associated health consequences. Discover strategic priorities and risk factors for obesity prevention. Explore the importance of access to healthy food and the impact of sugar-sweetened beverages on obesity. Find out about the relationship between physical activity and obesity. Join the Let's Get Healthy California initiative to promote a healthier lifestyle.

E N D
Obesity in California“Prevention is the Best Treatment” Ronald W. Chapman, MD, MPH Director and State Health Officer California Department of Public Health
Obesity Rates • Obesity rates nearly tripled among low-income children and teens in California over the past 30 years.1 • Nearly one in three California youth ages 10 – 17 years are overweight or obese.2 • In 1985 nearly 8% of adults in California were obese. In 2010 that tripled to almost 24%.3
Obesity Rates • Obesity rates among low-income children age 2 – 4 years in California declined 2008-2011.
The Cost of Obesity in California • In California obesity-attributable medical costs were $15.2 billion annually (2009 dollars) with 41.5% publically financed.4 • Lost productivity costs associated with overweight and obesity in California were $8.2 billion (2006 data)5 • If adult BMI was reduced by 5% California could save $81.7 billion in obesity-related health care costs by 2030.6
Health Consequences of Obesity • Obesity increases the risk of many health conditions:2 • Coronary heart disease, stroke, and high blood pressure • Type 2 diabetes • Cancers, such as endometrial, breast, and colon cancer • High total cholesterol or high levels of triglycerides • Liver and gallbladder disease • Sleep apnea and respiratory problems • Degeneration of cartilage and underlying bone within a joint (osteoarthritis) • Reproductive health complications such as infertility • Mental health conditions • Contributes to some of the leading causes of preventable death3
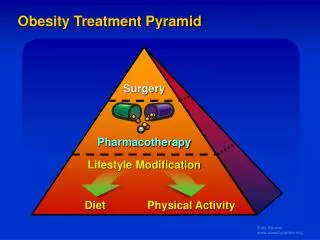
Strategic Priorities to Prevent Obesity and Chronic Disease • Increase access to and consumption of healthy foods and drink • Decrease access to and consumption of less healthy foods and drinks • Increase opportunities for safe physical activity through healthy community/transportation design • Decrease sedentary behavior
Risk Factors Obesity Factors Protective Factors Breastfeeding5 Exclusive (only breast milk) for at least 6 months Longer duration Dietary practices Fruit and vegetable consumption6-11 Regular physical activity17-18 Dietary practices Sugar-sweetened beverages12-15 High calorie, low nutrient foods16 Screen time Television viewing19-21 Sedentary behavior
Sugar-Sweetened Beverages (SSB) and Obesity • Nearly half of the added sugars consumed by Americans come from SSB6 • Children and adolescents who consume more SSB have higher body weight compared to those who drink less, and some evidence also supports this relationship in adults12-15
Let’s Get Healthy California Indicator:Sugar Sweetened Beverages, Adolescents • Proportion of adolescents who drank 2 or more glasses of soda or other sugary drinks per day • California target 17% • California baseline1 27% • California update2 30% • National target N/A • National baseline3 20% • National update4 19% 1 2009 California Health Interview Survey 2 2011 California Health Interview Survey 3 2009 Youth Risk Behavior Survey, 9th – 12th grader students 4 2011 Youth Risk Behavior Survey, 9th – 12th grader students
Physical Activity (PA) in California • Strong evidence indicates that regular PA helps people maintain a healthy weight and prevent excess weight gain17,18 • Proportion of Californians who get the recommended amount of PA • 45.6%of preschoolers27 • 30.4% of school-age children27 • 16.1% of adolescents27 • 25.3% of adults28
Active Transport and Obesity • Walking, bicycling, and public transit use contributes to daily physical activity, aerobic fitness, and cardiovascular health while helping to protect against obesity, diabetes, and other diseases1–9 • Active transportation in the US has decreased over time. • Each additional hour per day spent in a car is associated with a 6% increase in the likelihood of obesity (59)
Safe Physical Activity and Active Transportation • Design communities to safely accommodate pedestrians, bicyclists and public transit users as well as vehicles – complete streets • Safe Routes to School • Partner with transportation and traffic safety agencies on California Transportation Plan 2040 and Public Transit Plan
Let’s Get Healthy California Indicator: Fitnessgram, Youth • Proportion of children and adolescents who score 6 of 6 on the required California school Fitnessgramtest Grade 5 7 9 • California target 36% 46% 52% • California baseline1 25% 32% 37% • California update N/A N/A N/A • National target NC NC NC • National baseline2 NC NC NC • National update2 NC NC NC 1 2010-2011 California Fitness Report 2 NC = No comparable national data source
Access to Healthy Food and Obesity • Living closer to healthy food retail is associated with decreased risk for obesity and other diet-related diseases42There are 2.2 farmers’ markets per 100,000 residents in California (vs. 2.5 nationally)43 • Nearly one-third of adults in California reported having limited access to quality, affordable, and fresh FV in their neighborhood33
Access to UnhealthyFood and Obesity • Those living near an abundance of fast-food restaurants and convenience stores have a significantly higher prevalence of obesity and diabetes44 • Fast-food restaurants are often located near schools,45 and such close proximity has been linked to increased risk of obesity in schoolchildren46 • In 2005, there were 4 times as many fast food restaurants and convenience stores than supermarkets and produce vendors in CA47
Let’s Get Healthy California Indicator: Fruits and Vegetables, Adults • Proportion of adults who have consumed fruits and vegetables five or more times per day • California target 34% • California baseline1 28% • California update2 27% • National target N/A • National baseline1 24% • National update3 NC 1 2009 Behavioral Risk Factor Surveillance Survey 2 2011 Behavioral Risk Factor Surveillance Survey 3 NC = No comparable national data source is available – data no longer reported in the same format
Behavior Change Programs Increase referrals to, and use of, behavior change programs for people with chronic disease that increase physical activity, healthy eating and self-management • Walk With Ease • Chronic Disease Self-Management Program • Diabetes Self-Management Education • WISEWOMAN
California Wellness Plan Goals Overarching: Equity in Health and Wellness • Healthy Communities • Optimal Health Systems Linked with Community Preventive Services • Accessible and Usable Health Information • Prevention Sustainability and Capacity
Advancing Prevention in the 21st Century • February 13-14, 2014 in Sacramento • Four Focus Areas with strategies and action steps for collaborative work over the next 2 years • Showcase best practices • Obtain commitments from partners to contribute resources to Focus Areas Keynote presentations will be available online
California Obesity Prevention Plan • Developed in 2006 with extensive stakeholder input • Plan updated in 2010 • To be updated again in 2014 • Current data and trends • Streamline and focus strategies • Used to: • Guide CDPH’s obesity prevention work • Provide background information for the public • Inform: • grant proposals • program strategies and policy for partners
Nutrition Education and Obesity PreventionNEOP • Local assistance grants to local health departments and community organizations • Training and technical assistance • Breastfeeding trainings • Local school wellness support • Resources • Case studies • Toolkits • Nutrition standards • The NEOP Children’s Power Play! Campaign improved daily fruits and vegetables intake