Download
1 / 31
310 likes | 369 Views
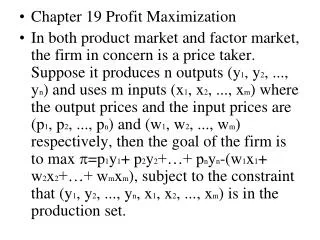
Profit Maximization. Ed. 7: Ch. 8, pgs 264-265, pgs 277-300 Ed. 6: Ch. 8, pages 265-266, pgs 278-304. Profit Maximization assuming:. Firm must charge every consumer the same price (i.e., no price discrimination) No Strategic Interaction among Firms We will consider two industry structures:

E N D
Profit Maximization Ed. 7: Ch. 8, pgs 264-265, pgs 277-300 Ed. 6: Ch. 8, pages 265-266, pgs 278-304
Profit Maximization assuming: • Firm must charge every consumer the same price (i.e., no price discrimination) • No Strategic Interaction among Firms We will consider two industry structures: • Monopoly • Monopolistic Competition
What output maximizes profits if the marginal revenue (MR) for each unit the firm sells is $55? What are these profits? 8 55*8-43.75*8=90
What output maximizes profits if the marginal revenue for each unit the firm sells is $35? What are these profits? 6 35*6-43.33*6=-50 Produce an output of 6 in short-run if fixed costs are sunk.
What output maximizes profits if the marginal revenue for each unit the firm sells is $25? What are these profits? 5? 25*5-46*5=-105 Better off producing 0 so profits=-FC=-100
Short-Run Profit Maximizing Rule • Produce at an Output where Marginal Revenue = Marginal Cost (MR) (MC) if Total Revenue > Variable Cost [When the firm cannot price discriminate, this is the same thing as saying as long as Price > AVC (from P*Q > AVC*Q) ]
Monopoly Characteristics • There is a single seller • There are no close substitutes for the good • There are extremely high barriers to entry
Long Run Average Total Cost Natural Monopoly (type of monopoly where there exists large economies of scale) $/unit when a single firm can supply a good or service to an entire market at a smaller cost than could two or more firms. ATC1/2 big firm ATCone big firm Q1/2 big firm Qbig firm 0 Quantity
Monopolist Marginal Revenue (with no price discrimination) +9 +7 +5 +3 +1 -1 Q -3 -5 MR -7 Note that Marginal Revenue for a given unit is plotted at the midpoint of that unit. -9
Use Calculus to Obtain MR curve for Linear Demand Curve Slope of D • Demand Curve: • P=a-bQ • TR • = (a-bQ)Q • =aQ-bQ2 • MR • =ΔTR/ ΔQ=∂TR/ ∂Q • =a-2bQ [In prior graph, a=10 and b=1] Slope of MR
Monopoly Elastic • If the firm’s goal were to maximize total revenue, where would it produce? • P=$5; hD=-1; TR=$25 Inelastic • The elastic and inelastic portions of the demand curve are labeled. How do these relate to MR? • Elastic: MR>0 • Inelastic: MR<0 Q • Will a monopolist ever produce on the inelastic portion of the demand curve? No. MR
Own Price Elasticity of Demand MR 0 10 10 6 16 TR 2 18 -2 16 -6 10 -10 0
MATH BEHIND: Maximizing Revenue and Own Price Elasticity equaling -1 • MaxQ TR = MaxQ P(Q)Q so Own Price Elasticity of Demand
Monopoly Maximizing Profits • If the monopolist maximizes profits, where would it produce? • At an output where MR=MC as long as P>AVC. • This is at an output of Q=4 so a price of P=6. Q MR
MATH BEHIND: Maximizing Profits being where MR=MC MaxQ Profits = MaxQ TR(Q)-TC(Q) so profits are maximized where Or where, Applies when Q>0
Monopoly Maximizing Profits TR Profits • At Q=4 and P=6, what is Total Revenue? TR=P*Q=6*4=24 • At Q=4, what are Total Costs? TC=ATC*Q=4.5*4=18 • At Q=4 and P=6, what are Profits? Profits=TR-TC=24-18=6 Or Profits=P*Q-ATC*Q =(P-ATC)*Q =(6-4.5)*4=6 Q TC MR
Monopoly Maximizing Profits Profits • What is the difference between these costs and the costs on the prior slide? FC are greater on the costs depicted to the right. • If the monopolist maximizes profits, where would it produce? Q=4 so set P=6. • Profits would be: TR-TC=6*4-8*4= -8 MR
Monopolist in Long Run Profits • What should this monopolist do in the Long Run assuming that the monopolist thinks his costs will not change and neither will demand? Keep producing Q=4 or change plant size depending if there is a plant size that would result in greater profits. Q MR
Monopolist in Long Run Profits • What should this monopolist do in the Long Run assuming that the monopolist thinks his costs will not change and neither will demand? Exit the industry or change plant size depending if there is a plant size that would result in positive profits given demand curve. MR
Monopolistic Competition Characteristics • There are many buyers and seller • Each firm in the industry produces a differentiated product • There is free entry into and exit from the industry [Think bakery or coffee shop in big city.]
Bakery in a Monopolistically Competitive Industry Maximizing Profits in the Short Run • If bakery maximizes profits, where would it produce? Where MR=MC which is at an output of Q=3.5 so a price of P=8. • What are the bakery’s profits? TR-TC=P*Q-ATC*Q =8*3.5 - 6.25*3.5 = 6.12 MR
Bakery in a Monopolistically Competitive Industry Maximizing Profits in the Long Run • In long-run if the bakery is making positive economic profits, we would expect other bakeries to enter causing a reduction in demand. • What are maximum profits when demand is D’? Q=3 so a price of P=6.67. Profits=P*Q-ATC*Q =6.67*3-6.67*3=0 D’ MR
Marginal Revenue from 5th Unit is just the shaded area below. This area is $11. When the MR curve is linear, the area under the MR curve can be obtained by just taking the MR at the midpoint of the quantities – in this case at 4.5. The orange area is the same as the purple area. MR
Marginal Cost of 5th Unit is just the shaded area below. This area is $9. When the MC curve is linear, the area under the MC curve can be obtained by taking the MC at the midpoint of the quantities – in this case at 4.5. The purple area is the same as the red area MR
Change in Profits associated with producing 5 Units rather than 4 units. Yellow area is change in profits associated with producing 5 units rather than 4 units. This area is $2. Subtract MC of 5th unit from MR of 5th unit– brown area from purple. MR
PROFIT MAXIMIZATION Profits are maximized at an output where MR=MC which is Q=5. Price is 15 and ATC is 11.2 at Q=5. Profits are then 15*5-11.2*5=19 15 11.2 MR