Download
1 / 1
10 likes | 89 Views
Soil Organic Carbon Budget as Related to Land Use History in the Northwestern Great Plains. Zhengxi Tan *,1,2 , Shuguang Liu 2 , Carol A. Johnston 1 , Thomas R. Loveland 3 Jinxun Liu 4 , Rachel Kurtz 3 , and Larry Tieszen 3 1 South Dakota State University, Brookings, SD 57007

E N D
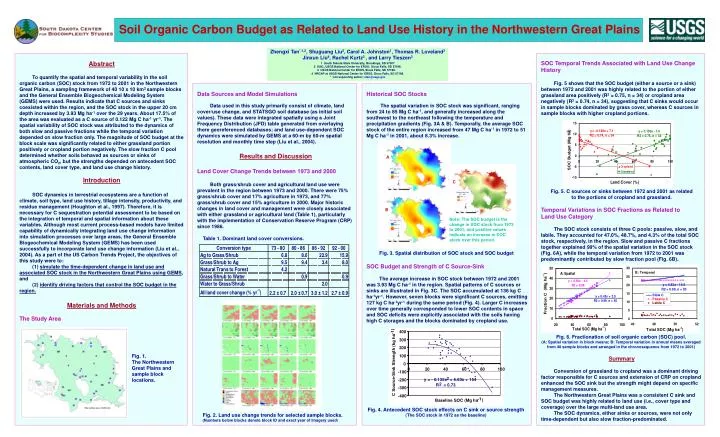
Soil Organic Carbon Budget as Related to Land Use History in the Northwestern Great Plains Zhengxi Tan*,1,2, Shuguang Liu2, Carol A. Johnston1, Thomas R. Loveland3 Jinxun Liu4, Rachel Kurtz3 , and Larry Tieszen3 1 South Dakota State University, Brookings, SD 57007 2 SAIC, USGS National Center for EROS, Sioux Falls, SD 57198. 3 USGS National Center for EROS, Sioux Falls, SD 57198. 4 NRCAP at USGS National Center for EROS, Sioux Falls, SD 57198. * Corresponding author: ztan@usgs.gov Abstract To quantify the spatial and temporal variability in the soil organic carbon (SOC) stock from 1972 to 2001 in the Northwestern Great Plains, a sampling framework of 40 10 x 10 km2sample blocks and the General Ensemble Biogeochemical Modeling System (GEMS) were used. Results indicate that C sources and sinks coexisted within the region, and the SOC stock in the upper 20 cm depth increased by 3.93 Mg ha-1 over the 29 years. About 17.5% of the area was evaluated as a C source of 0.122 Mg C ha-1 yr-1. The spatial variability of SOC stock was attributed to the dynamics of both slow and passive fractions while the temporal variation depended on slow fraction only. The magnitude of SOC budget at the block scale was significantly related to either grassland portion positively or cropland portion negatively. The slow fraction C pool determined whether soils behaved as sources or sinks of atmospheric CO2, but the strengths depended on antecedent SOC contents, land cover type, and land use change history. Introduction SOC dynamics in terrestrial ecosystems are a function of climate, soil type, land use history, tillage intensity, productivity, and residue management (Houghton et al., 1997). Therefore, it is necessary for C sequestration potential assessment to be based on the integration of temporal and spatial information about these variables. Although most current process-based models have limited capability of dynamically integrating land use change information into simulation processes over large areas, the General Ensemble Biogeochemical Modeling System (GEMS) has been used successfully to incorporate land use change information (Liu et al., 2004). As a part of the US Carbon Trends Project, the objectives of this study were to: (1) simulate the time-dependent change in land use and associated SOC stock in the Northwestern Great Plainsusing GEMS, and (2) identify driving factors that control the SOC budget in theregion. Materials and Methods The Study Area SOC Temporal Trends Associated with Land Use Change History Fig. 5 shows that the SOC budget (either a source or a sink) between 1972 and 2001 was highly related to the portion of either grassland area positively (R2 = 0.75, n = 34) or cropland area negatively (R2 = 0.74, n = 34), suggesting that C sinks would occur in sample blocks dominated by grass cover, whereas C sources in sample blocks with higher cropland portions. Fig. 5. C sources or sinks between 1972 and 2001 as related to the portions of cropland and grassland. Temporal Variations in SOC Fractions as Related to Land Use Category The SOC stock consists of three C pools: passive, slow, and labile. They accounted for 47.0%, 48.7%, and 4.3% of the total SOC stock, respectively, in the region. Slow and passive C fractions together explained 99% of the spatial variation in the SOC stock (Fig. 6A), while the temporal variation from 1972 to 2001 was predominantly contributed by slow fraction pool (Fig. 6B). Data Sources and Model Simulations Data used in this study primarily consist of climate, land cover/use change, and STATSGO soil database (as initial soil values). These data were integrated spatially using a Joint Frequency Distribution (JFD) table generated from overlaying there georeferenced databases; and land use-dependent SOC dynamics were simulated by GEMS at a 60-m by 60-m spatial resolution and monthly time step (Liu et al., 2004). Results and Discussion Land Cover Change Trends between 1973 and 2000 Both grass/shrub cover and agricultural land use were prevalent in the region between 1973 and 2000. There were 75% grass/shrub cover and 17% agriculture in 1973, and 77% grass/shrub cover and 15% agriculture in 2000. Major historic changes in land cover and management were closely associated with either grassland or agricultural land (Table 1), particularly with the implementation of Conservation Reserve Program (CRP) since 1986. Table 1. Dominant land cover conversions. Historical SOC Stocks The spatial variation in SOC stock was significant,ranging from 24 to 85 Mg C ha-1, and generally increased along the southwest to the northeast following the temperature and precipitation gradients (Fig. 3A & B). Temporally, the average SOC stock of the entire region increased from 47 Mg C ha-1 in 1972 to 51 Mg C ha-1 in 2001, about 8.3% increase. Fig. 3. Spatial distribution of SOC stock and SOC budget SOC Budget and Strength of C Source-Sink The average increase in SOC stock between 1972 and 2001 was 3.93 Mg C ha-1 in the region. Spatial patterns of C sources or sinks are illustrated in Fig. 3C. The SOC accumulated at 136 kg C ha-1yr-1. However, seven blocks were significant C sources, emitting 127 kg C ha-1yr-1 during the same period (Fig. 4). Larger C increases over time generally corresponded to lower SOC contents in space and SOC deficits were explicitly associated with the soils having high C storages and the blocks dominated by cropland use. A C B Note: The SOC budget is the change in SOC stock from 1972 to 2001, and positive values indicate an increase in SOC stock over this period. -1) 400 Fig. 6. Fractionation of soil organic carbon (SOC) pool. (A: Spatial variation in block means; B: Temporal variation in annual means averaged from 40 sample blocks and arranged in the chronosequence from 1972 to 2001) 300 200 Fig. 1. The Northwestern Great Plains and sample block locations. 100 Summary Conversion of grassland to cropland was a dominant driving factor responsible for C sources and extension of CRP on cropland enhanced the SOC sink but the strength might depend on specific management measures. The Northwestern Great Plains was a consistent C sink and SOC budget was highly related to land use (i.e., cover type and coverage) over the large multi-land use area. The SOC dynamics, either sinks or sources, were not only time-dependent but also slow fraction-predominated. 0 C Source-Sink Strength (kg ha 0 20 40 60 80 100 -100 2 y = - 0.135x + 6.63x + 154 -200 2 R = 0.73 -300 -400 -1 ) Baseline SOC (Mg ha Fig. 4. Antecedent SOC stock effects on C sink or source strength (The SOC stock in 1972 as the baseline) Fig. 2. Land use change trends for selected sample blocks. (Numbers below blocks denote block ID and exact year of imagery used)


![Thomas Cowperthwait Eakins [1844 – 1916]](https://cdn0.slideserve.com/444603/thomas-cowperthwait-eakins-1844-1916-dt.jpg)