Download
1 / 24
240 likes | 305 Views
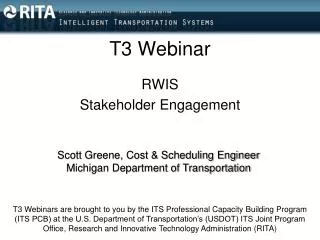
U.S. DOT T3 Webinar Mobile Device Technology TCRP Synthesis 91 April 10, 2012. Case Study LeeTran – Lee County, FL Mike Horsting, AICP. Presentation Outline. Lee County Background Situation and Need Identified Solution Technology Procurement and Installation Trouble-shooting

E N D
U.S. DOT T3 WebinarMobile Device Technology TCRP Synthesis 91April 10, 2012 Case Study LeeTran – Lee County, FL Mike Horsting, AICP
Presentation Outline • Lee County Background • Situation and Need • Identified Solution • Technology Procurement and Installation • Trouble-shooting • Results and Benefits
Who is LeeTran? • Lee County Transit – Fort Myers, FL • County-wide bus route network • 18 bus routes • Bus fleet of 61 • 3.1 million annual passenger trips • Traditional transit rider and tourists
Town of Fort Myers Beach Lee County Transit Lee County Department of Transportation State of Florida Department of Transportation Stakeholders
Identifying the Problem • Tourism Destination • Great beaches and warm, sunny winters • Island Community with Limited Access • Significant to Severe Congestion • Limited Parking • Driver Behavior • Limited Transit
Identifying the Needs • Additional Passenger Information • Number one passenger request • Reduce the guessing • (When will the trolley be here?) • Manage Congestion • Give Transit the Advantage • Reduce Road-Rage
Packaging a Solution • Intelligent Transportation Systems • Real-Time Passenger Information • First at stops, then mobile devices • Increase Capacity by Reducing Headways • Dedicated Transit Lane over Bridge • Free Parking • Marketing Campaign • Luggage / Gear Racks
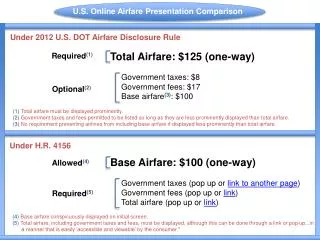
ITS Requirements • Web-based and Cost effective solution • Real-Time Information must be: • 80% accuracy for 10 minute predictions • 90% accuracy for 5 minute predictions • Vendor support for changes and upgrades • LED displays at four key stop locations • Expandable to other routes, vehicles and information mediums
Solution Procurement • Solicitation - RFP • Evaluation Criteria: • Stability • Recent Experience • References • Technical Proposal • Software Requirements • Price • Initial 5 year contract with vendor
Installation and Testing • Vehicle Installation • LED Displays at Stations • Power Sources • Initial learning period 1-2 months • Off-season time period • Quick accuracy • One route • Test Launch and Monitor
Initial Information Sources • LED Displays • Arrivals and Current Time • Internet • Arrivals and Interactive Map • SMS (phase II) • Text
Deployment • Training • Dispatchers and Supervisors • Operators • Marketing and Advertising • Brochures • Variable Message Boards • Monitoring into Winter Season • Field Observations
Reality • Seasonal Congestion too Severe • Software Miscalculations • Vehicles “Dropping-out” • Inaccurate Predictions • Operational Frustrations • Solar-powered Signs
Fixing Reality • Schedule-based Predictions • Headway-based Predictions • “Loop Jobs” • Accuracy Achieved
Expansion • Added Information via Mobile Device • Two additional routes • Entire beach zone • Entire dedicated fleet installation • All stops • Stop ID numbers
Pushback/Results • “Our customers don’t use smart phones” • SMS Text messaging • Website • Smartphone • Alerts
Overall Improvements • Improved Customer Satisfaction • No more guessing at 4 major stops • Business Owner Satisfaction • Customer information • Extra business • Accurate Real-time Information • Positive customer feedback • Ridership increase of 32%
Additional Benefits • Dispatch • Vehicle location monitoring • On-time performance • Additional Customer Information • Service Advisories and Delays • Planned service changes
Cost, Time, Staffing, Budgeting • Initial procurement of $60,000 • Hardware • Installation • First year operating costs • Annual operating costs of $12,000 • Lowered wireless costs after 5 years • TIME!
Thank You! Mike Horsting, AICP horstingm@rtachicago.org