Download

1 / 11
110 likes | 256 Views
Marathon Exploration. WebQuest. INTRODUCTION. Marathons are quickly becoming a challenge for not only elite athletes but also for amateur runners around the world.

E N D
Marathon Exploration WebQuest
INTRODUCTION • Marathons are quickly becoming a challenge for not only elite athletes but also for amateur runners around the world. • You are a reporter and writing an article on the trends in marathons. You will need to analyze a marathon runners’ stats in one or more of the most notable marathons in the world. This data will then be organized and graphed/charted in a summary and submitted to your editor.
Task • Students will be grouped in pairs • Each group will use the websites listed on the next slide to gather data about elite marathon runners and explore relationships between distance, rate and time (d=rt)
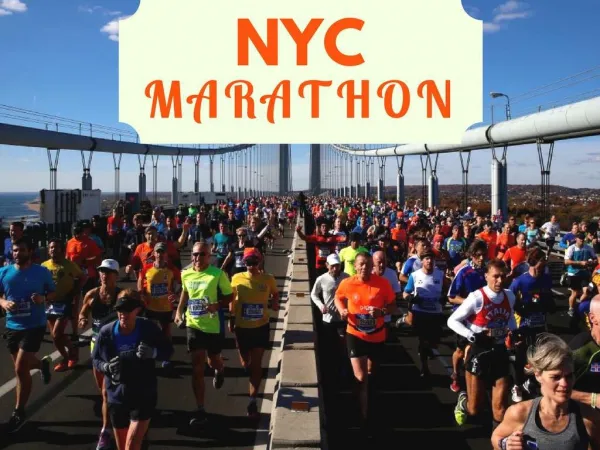
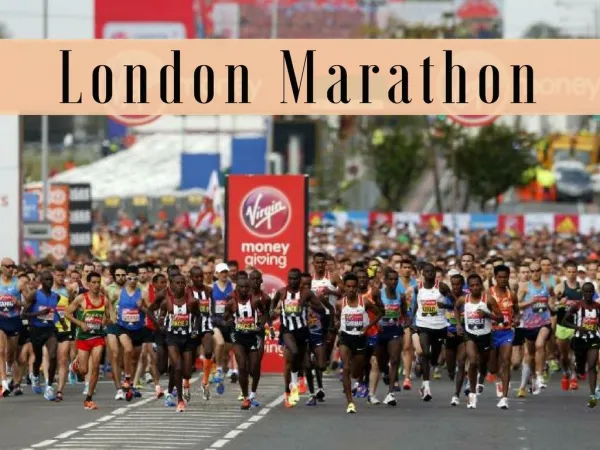
Task, cont. • NYC Marathon • Boston Marathon • Chicago Marathon • London Marathon • Basic Distance Equation • Advanced Distance Equation • Google Maps
Task, cont. • Once the required data is collected students will perform the calculations needed in the analysis. • Students will organize their data in a spreadsheet and provide answers to the questions listed in the process section of this WebQuest.
Process • Who won the Boston, NYC, London or ChicagoMarathon in 2008? • What was the average mile time for the winner in 2008? • At this rate, how long would it take this runner to run from Pocono Pines to Philadelphia? You will need to find this distance somewhere. Google Mapsis a good utility for finding distances. • In paragraph form, discuss how you derived your answer. Be sure to include any math calculations you used.
Process, cont. • What was the average mile time for the winners of the women's race from 2000 to 2008? • What is the median of the average mile times from the winners of the women's race from 2000 to 2008? Show your work to justify your answer. • What is the mean of the average mile times from the winners of the women's race from 2000 to 2008? • Study the data for the last 100 years of the men's race winners.
Process, cont. • Make a list of the fastest times by decade: 1900s, 1910s, 1920s,... up to 1990s. Put this list of data in an Excel spreadsheet (two columns, year and time). • Make a graph of this data. Use the chart wizard. • Speculate (in writing) what trends you see. You should copy and paste your Excel spreadsheet in your Word document. • What did you label the x and y axis? • Do the data points seem to fit in a straight line or a curve? • Are the speeds increasing or decreasing?
Conclusion • In gathering and analyzing this data, you should be able to form conclusions about the trends occurring in marathons across the world. • During the evaluation of the data, you should have become familiar with central tendencies, such as mean and median, and also with the distance equation. • During the organization of your data, you should have been exposed to the many resources available in excel and word.
Conclusion, cont. • Reflect on the data that you ave gathered and analyzed. • What are some factors that have contributed to faster times by modern marathon runners? • Describe the relationship between time and speed(rate).