Download
1 / 16
160 likes | 163 Views
Learn how LIGO monitors and maintains the quality of data to ensure accurate scientific analysis. Explore the techniques used to assess calibration stability, interferometer state, physical environment, and more.

E N D
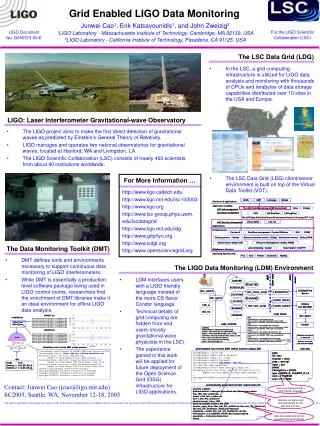
John Zweizig LIGO / Caltech Data Quality Monitoring at LIGO
Good Data? • Before doing scientific analysis one must know how good are the data • Calibration stability (optical gain, etc.) • Interferometer state • Physical environment (seismic noise, wind, acoustic noise) • Control loop transients • Oops (you did What during science running?) • Astrophysical search sensitivities • Mechanism to do this finally set (after ~10 engineering runs, 4 science runs!) • 1.5-2 year run: Must keep up with data! • LSC in general and Detector Characterization (DetChar) group specifically have dedicated many hours to concurrent understanding of data • Science monitor shifts, data quality investigations, DetChar group and subgroup meetings.
How Does LSC Acquire and Use DQ Information? • On-line Data Monitoring • Constant automatic monitor of IFO state, sensitivity, calibration, transients, environmental noise, etc. • Science monitors and operators note running conditions in eLog • Concurrent Data Quality Investigations • “Glitch group” has shifts, weekly meetings to run through noisiest events • Calibration monitored, time variation parameterized. • Tabulate run epoch information • Define time segments that have specific (good or bad) properties. • Record segment in online database • Use in analysis • Analyse epochs determined to be “safe” for a particular analysis
Epochs or Vetoes? • In theory • Epochs used to handle exceptional conditions that are • Long term several second to hours • Affect reliability or alter noise spectrum greatly • Disable analysis of data in time epoch. • Vetoes used for transients (short term effects) • Analyse data, but reject any GW candidate. • Minimizes dead-time • Simplifies analysis job submission • In practice • Difficult to determine extent of effects (e.g. are signals really linear around PD overflows?) • Epoch easier to use than vetoes (much better tools) • Most data quality flags used to define epochs (at discretion of analysis groups)
Online Data Monitoring (DMT) • Real-time data monitoring software • Infrastructure & run support from LIGO Lab • Monitor code, configuration LSC/DC responsibility • Monitor environment/performance parameters, e.g. • Inspiral range • Lock State • Strain noise spectrum • Calibration Line sptrngts • Band-limited seismic noise • Display real-time results • Graphical output • html summary pages.
Online Monitoring (cont’d) • Record statistical quantities in “trend frames” • Machine readable record of performance/noise statistics • 1.4 × 1.4 Msun binary NS inspiral range • Band-limited seismic noise • Record triggers • Transient noise • LSC Science Monitor (SciMon) Shifts • On shift 20 hours per day (two 10 hour shifts, every day) • Watch/summarize online data monitor display • Investigate source of any unusual noise • Several fall-back projects during smooth running.
Data Quality Investigations • DetChar group subdivided into teams. Investigate: • Calibration • Transients • Line features • Data quality • Example: Transients (Glitch) group: • Glitch shifts (1 person per week) • Summarize electronic log notes • Summarize running conditions • Investigate loud single-IFO triggers from analysis pipelines • Automatic displays of loudest triggers • Event display (S. Desai): Spectrograms of many channels • Q-Scan (S. Chatterji): Q-Transform, select channels with loud noise clusters • Weekly discussion with DetChar Glitch group
Example: Calibration Line Errors • Calibration lines • Used to monitor IFO optical gain. • Inject three sinusoids (~50, ~550, ~1100Hz) into differential length control channel. • Injected signals written to frames • Several problem with injection process discovered • Single sample drop-outs • 1-second dropouts • Repeated 1-second segments • Monitoring to detect future errors • Calibrations notched out • 5σ excursions generate triggers • Trigger identified (offline script) Segments produced to cover triggers
Q-Scan Display (snapshot) WhitenedTime Series WhitenedSpectrograms
Data Quality Segments • Segments: • Tag run periods with a given common property • Defined by automatically by DMT monitor or inserted manually from tabulated segments. • DB2 database contains: • Segment data • Start, stop times • Type, Version • IFOs • Provenance data • Program name, version • User ID
Segment Database • Database interfaces • LSCSegFind: Command line database query • Text files • Available over web • Used by SegWizard and automated analysis pipelines • SegWizard GUI • User selects single or multiple IFOs in science mode • Remove any combination of data quality segments (click on segment name) • Prints a list of time ranges to be analysed • Example segment types • IFO states, e.g. Science or Injection mode • Environmental noise sources: Unusual seismic noise, High winds • IFO conditions: PD saturation, ADC overflows, Calib line dropouts
Use of Data Quality in Analyses • Segments defined with no guarentees • No guarantee of efficacy • Could cause some GW signals to self-veto • Analysis groups must • Decide which segments are appropriate • Test segment safety (does it veto loud injections?) • Decide whether to analyse data from segment, treat as a trigger veto or ignore.
Summary • LIGO Detector Characterization group monitors data quality with online software and concurrent investigations • “Segments” define epochs of data with specific (good or bad) properties. • Analysis groups use run epochs as appropriate to their search