Download
1 / 13
140 likes | 208 Views
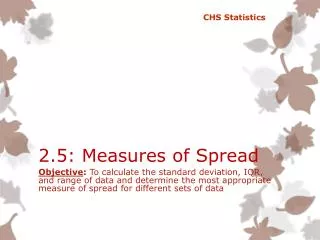
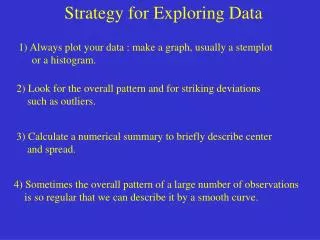
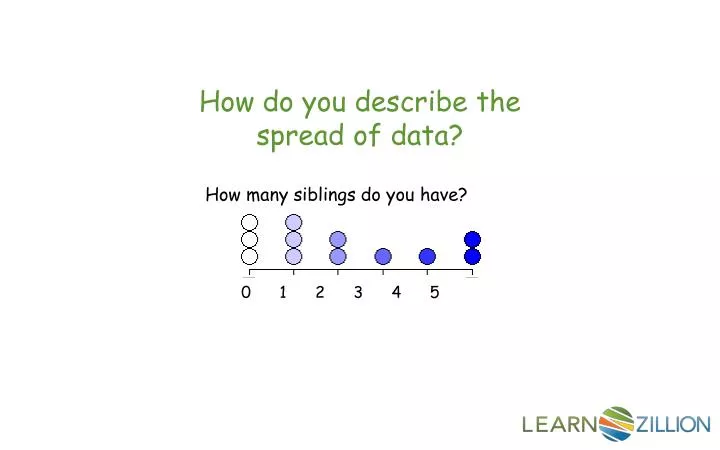
How do you describe the spread of data?. How many siblings do you have?. 0 1 2 3 4 5. In this lesson you will learn how to summarize the spread of data with a single number by calculating and examining the range and mean absolute deviation of the data.

E N D
How do you describe the spread of data? How many siblings do you have? 0 1 2 3 4 5
In this lesson you will learn how to summarize the spread of data with a single number by calculating and examining the range and mean absolute deviation of the data.
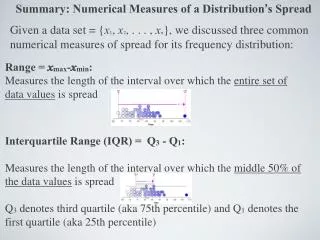
Reading a line plot How many books did 6th graders at Taylor Middle School read this summer? 0 2 4 6 8 10 12 14 16 18 20 22 Number of Books
Sometimes students confuse the mean and the mean absolute deviation. Mean Mean Absolute Deviation Center Spread
Finding the Range 5 -0 5 How many siblings do you have? 0 1 2 3 4 5
Finding the Mean Absolute Deviation How many siblings do you have? Mean = 2 Mean Absolute Deviation = 1.5 0 1 2 3 4 5 2 2 2 2 • 1 1 1 0 0 3 3 0 + 0 + 0 + 1 + 1 + 1 + 2 + 2 + 3 + 4 + 5 + 5 = 24 24 ÷ 12 = 2 2 + 2 + 2 + 1 + 1 + 1 + 0 + 0 + 1 + 2 + 3 + 3 = 18 18 ÷12 = 1.5
Comparing the Range and the Mean Absolute Deviation How many siblings do you have? 0 1 2 3 4 5 Range = 5 Mean Absolute Deviation = 1.5
In this lesson you have learned how to summarize the spread of data with a single number by calculating and examining the range and mean absolute deviation of the data.
Find the range and mean absolute deviation of this data. How can we use these to describe the spread of data?
Find a graph or some data in a newspaper or online. Find the range and mean absolute deviation. How do they describe the spread?
Choose 2 random numbers to be the range and the mean absolute deviation. Can you write data to match these measures?
Find the range and mean absolute deviation of this data. How can we use these to describe the spread of data? 2 4 6 8 10 12 Number of CDs owned
Find the range and mean absolute deviation of this data. How can we use these to describe the spread of data? How many pairs of shoes do 6th graders at Wilson Junior High School own?