Download
1 / 18
180 likes | 324 Views
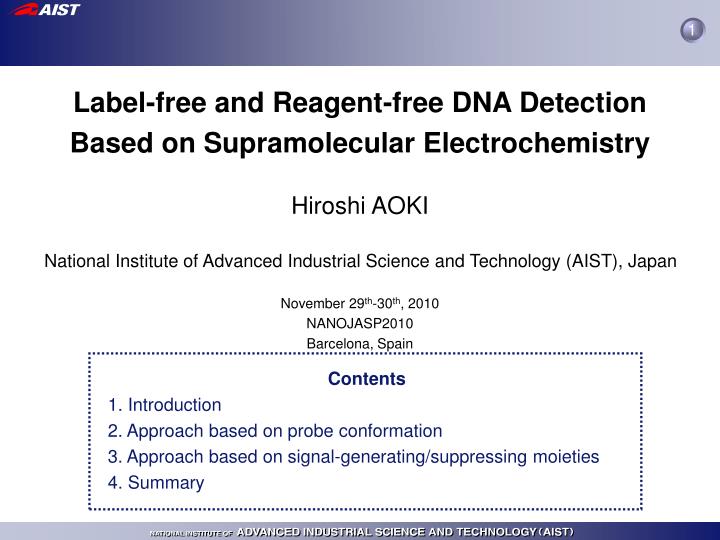
1. Label-free and Reagent-free DNA Detection Based on Supramolecular Electrochemistry Hiroshi AOKI National Institute of Advanced Industrial Science and Technology (AIST), Japan November 29 th -30 th , 2010 NANOJASP2010 Barcelona, Spain. Contents 1. Introduction

E N D
1 Label-free and Reagent-free DNA Detection Based on Supramolecular Electrochemistry Hiroshi AOKI National Institute of Advanced Industrial Science and Technology (AIST), Japan November 29th-30th, 2010 NANOJASP2010 Barcelona, Spain Contents 1. Introduction 2. Approach based on probe conformation 3. Approach based on signal-generating/suppressing moieties 4. Summary
mRNAs biological effect chemical exposure extraction cell DNA microarray Mechanism of Biological Effect 2 Mechanism of Biological Effect of Chemical Substances cell body gene expression environment proteins enzymes chemicals transciption nucleolus Gene expression allows to evaluate biological effect at a genetic level and to collect genetic information rapidly without animal tests. DNA microarray is widely used in a laboratory level as a comprehensive diagnosis tool for gene expressionin medical and environmental fields.
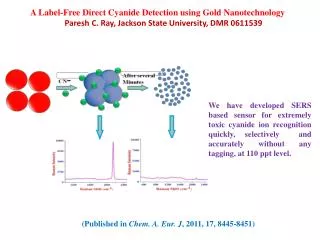
Example DNA microarray scanner (company A) Size: 60 x 90 x 60 [cm] Background 3 A conventional technique of oligonucleotide detection --- Spectroscopic technique based on fluorescence labeling DNA microarray fluorescent label hn probe target Hybridization solid surface Probe array Present problems - Time-consuming and expensive process - Affection to quantitativity - Needing a wash for removing unbound targets We have studied on these problems by electrochemical approaches, expected to contribute simplifying and size-reducing the detection system.
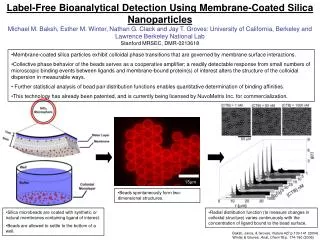
Approach based on electrostaticts Hybridization changes the surface charge, inhibiting redox reaction of the marker, enables label-freetarget detection. ON OFF ON OFF OFF ON Approaches 4 electroactive marker: [Fe(CN)6]4- electroactive moiety: Fc Approach based on probe conformation Hybridization makes the probe structure more rigid, inhibiting redox reaction of Fc, enables label- and reagent-free target detection(self-reporting DNA detection). signal-suppressing moiety: β-CD Approach based on signal-generating/suppressing moieties Hybridization makes the probe structure more rigid, restoring redox reaction of Fc, enables self-reporting and “signal-on” target detection (“OFF”→“ON”). signal-generating moiety: Fc Simple and rapid electrochemical gene detection techniques
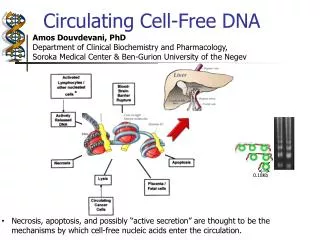
Approach based on probe conformation 5 Scheme of electrochemical experiments 5’ 3’ probe solution electrode signal peptide nucleic acid (PNA) anchor Sequences for the probe and targets Modification Fc-PNA: DNA_1: DNA_2: probe Fc-PNA complementary to Fc-PNA mismatched to Fc-PNA 5’GCA ACC TTC CCT ATT ACT CCA C 3’ 3’CGT TGG AAG GGA TAA TGA GGT G 5’ 3’ATG ACA CCA ATA ACG ACA GA 5’ - probe: 0.1 mM Fc-PNA for 2 h - thiol: 1 mM 11-HUT for 12 h Fc-PNA after incubation for 20 min, at 65 oC, cooling down to 25 oC 11-HUT Ag/AgCl reference electrode Pt auxiliary electrode Incubation Measurement target DNAs in 0.1 M NaClO4 + 2.5 mM phosphate buffer (Na+, pH 7.0) in 0.1 M NaClO4 + 2.5 mM phosphate buffer (Na+, pH 7.0) Electrochemical measurement - cyclic voltammetry (CV) - square wave voltammetry (SWV)
Fc-PNA gold electrode CV Scan rate: 0.01 V s-1 RS–Au + e– RS– + Au0 Fc0 Fc+ + e- Fc: 33.1 pmol cm-2 surface density of Fc Every probe is immobilized on the surface, keeping its Fc moiety. Electrochemical characterization 6 Evaluation of probe surface density based on electron transfer reaction CV for the electrode in a buffer solution CV for the electrode in 0.5 M KOH CV Scan rate: 0.1 V s-1 S-Au: 32.9 pmol cm-2 surface density of S-Au bonds
2 diffusion-like motion CVs Scan rate: 0.2 V s-1 – 51.2 V s-1 1 Current · (Scan Rate)-1 / µA s V-1 0 surface-confined motion -1 DEp -2 0 0.2 0.4 0.6 Potential / V vs Ag/AgCl More irreversible CVs were measured at higher scan rates, indicating the Fc moiety needs more time for diffusion to cause electron transfer. Change in probe flexibility 7 Change in probe flexibility — before hybridization Dependence of CVs on scan rate (DNA_1 = 0 M) Scheme 1: Thermal vibration bulk Access to the surface proceeds to Fc redox reaction surface peak potential separation, DEp, vs scan rate, v * H. Aoki and H. Tao, Analyst 2007,132, 784-791.
2 1 slope ~1/2 0 -1 slope ~1 -2 0 0.2 0.4 0.6 The change in the Fc character revealed that the Fc moiety is located at the loose end of the probes, subject to thermal vibration. From slopes in the plot of log ipa vs log v, 1 1. slope ~1, surface-confined motion 2. slope ~1/2, diffusion-like motion Change in probe flexibility 8 Change in probe flexibility — before hybridization Dependence of CVs on scan rate (DNA_1 = 0 M) CVs ipa Current · (Scan Rate)-1 / µA s V-1 Potential / V vs Ag/AgCl Plot of log(anodic peak current, ipa) vs log(scan rate, v) diffusion-like motion surface-confined motion vc * H. Aoki and H. Tao, Analyst 2007,132, 784-791.
Scheme 2: Change in probe flexibility before hybridization after hybridization e– 0 M 10-4 M Approach based on probe conformation 9 Change in probe flexibility — after hybridization Peak potential separation vs scan rate (DNA_1 = 0 M) 10-4 M 0 M change in flexibility Plot of log(anodic peak current, ipa) vs log(scan rate, v) Upon hybridization, the value of scan rate at which the motion changes (vc) was shifted to be lower. This suggests the decrease in probe flexibility. Detection of target DNAs using this change in Fc character change in flexibility
DNA_2 (mismatch): 10–4 M (i – i baseline) / (io–ibaseline) DNA_1 (complementary) Detection limit: 1.4 x 10⁻¹¹ M Hybridization with target DNAs 10 DNA concentration dependence Dependence of CVs on DNA concentration Sensor response dependence on target concentration (SWV) CVs 0 M Scan rate: 1 V s-1 10-4 M DNA_1 Dependence of SWV on DNA concentration SWVs 0 M Step potential: 2 mV Amplitude: 25 mV Frequency: 50 Hz • Detection limit: 1.4×10⁻¹¹ M (S/N = 3.0) • Sequence-specific DNA detection was achieved • based on the change in the probe flexibility • without labeling targets nor adding external • markers (“self-repoting”). io–ibaseline 10-4 M of DNA_1 i–ibaseline * H. Aoki and H. Tao, Analyst 2007,132, 784-791.
DNA_2, 10–4 M denaturation 1st measurement denaturation DNA_1, 10–4 M DNA_1, 10–4 M Repeated use of the sensors 11 Repeated use of the prepared DNA sensors Relative change in peak currents in regeneration process Regeneration of the sensors SWVs denaturation Step potential: 2 mV Amplitude: 25 mV Frequency: 50 Hz rehybridization (10-4 M of DNA_1) The electrodes modified with Fc-DNA monolayer can be used repeatedly. - 1…1st measurement (right after prep.) - 2, 4…1st and 2nd hybridization DNA_1, 10–4 M - 3, 5…1st and 2nd denaturation (in 2 M urea, 65 oC) - 6…mismatched DNA_2, 10–4 M * H. Aoki and H. Tao, Analyst 2007,132, 784-791.
Fc-PNA DNA “OFF” “ON” Other contemporary probes 12 “Self-reporting” probes from other research groups Molecular beacon (PNAS, 2003, 100, 9134 (Plaxco et al.)) Aptamer (Angew. Chem.,2005,44, 5456 (Plaxco et al.)) Detection limit: 10 pM Detection limit: 6.4 nM Change in flexibility (JACS, 2003,125, 1112 (Anne et al.)) Aptamer (JACS, 2006,128, 117 (O’Sullivan et al.)) Detection limit: 0.5 nM Detection limit: 5 µM Electron wire (PNAS,2005,102, 11606 (Inouye et al.)) Change in flexibility (Analyst, 2007,132, 784 (Aoki et al.)) Detection limit: 14 pM Detection limit: 100 µM Improvement of sensitivity due to high Tm and flexibility in PNA Almost of all reported probes were based on a “signal-off” architecture.
Fc Hybridization e– “ON” “OFF” marker:[Fe(CN)6]4– e– Hybridization “ON” “OFF” Approach based on a “signal-on”architecture 13 Self-report&“signal-on” Improvement of sensitivity for DNA detection The use of probes emitting signals upon hybridization, i.e., “signal-on” probes, is important. probe e– “Signal-on” architectures have advantage of higher sensitivity over “signal-off” ones. Hybridization electrode “OFF” “ON” Patent application: -JP patent application 2008-168546, 2009-208400, 2009-242921, 2010-193207 Self-reporting β-cyclodextrin Inclusion complex dissociation DNA ferrocene Reagent-free e– Hybridization Suppressing redox activity “OFF” Restoring redox activity “ON” Development of label- and reagent-free (self-reporting), and “signal-on” probes. Label-free
Width: 10 µm Gap: 5 µm Length: 2 mm Number: 65 Approach based on a “signal-on” architecture 14 Scheme of electrochemical experiments Fc hybridization e– e– electrode CD-DNA-FC Detection system using probes without anchors enables detection in bulk solutions. Sequences of the probe and target 5’GCA ACC TTC CCT ATT ACT CCA C 3’ 3’CGT TGG AAG GGA TAA TGA GGT G 5’ CD-DNA-Fc: DNA: CD-DNA-Fc (22 mer) complementary to CD-DNA-Fc Interdigitated array electrode (carbon) Measurement 3.125 pmol, 5 µL CD-DNA-Fc in 7.5 mM NaCl + 75 mM phosphate buffer (Na+, pH 7.0) Electrochemical measurement --- cyclic voltammetry (CV) scan rate: 0.01 V s-1
e- e- 0 -2 -4 OH OH -6 0 0.1 0.2 0.3 0.4 0.5 Results 15 Dependence of CVs on target concentration [ref.] SWV of HMFc(0.3 mM) + β-CD(15 mM) SWVs Step E: 2 mV Amplitude: 25 mV Frequency: 50 Hz CVs 20 0 mol 20 e- 10 e- 12.5 pmol 10 Current, I/nA Current, I/nA 0 -10 0 Ferrocene moiety ・Redox potential:negative shift of Δ62 mV ・Current change: 1.3 nA 6.9 nA(5-fold) The redox activity of Fc was restored. -20 12.5 pmol 0 0.1 0.2 0.3 0.4 0.5 0.6 0.1 0.2 0.3 0.4 0.5 Potential, E/V Potential, E/V Current / µA The probe works based on a self-reporting “signal-on” architecture. 0 mol Article:Supramol. Chem., 22, 455 (2010) Potential / V vs AgAgCl
“ON” “OFF” Summary 16 Fc hybridization 1. Based on conformational flexibility change in probe structure, label-free and reagent-free (“self-reporting”) DNA detection was achieved. e– e– electrode 2. Based on signal-generating and suppressing moieties in a probe, “self-reporting” and “signal-on” DNA detection was achieved. These approaches are expected to contribute to more simple and rapid DNA detection.
At last … What is AIST? 17 Tsukuba, 45 min from Tokyo Mt. Tsukuba University of Tsukuba Japan Aerospace Exploration Agency (JAXA) National Institute for Materials Science (NIMS) National Institute of Advanced Industrial Science and Technology(AIST) Tsukuba Express (TX), established in 2005
Acknowledgements 18 • Collaborators • - Prof. Emeritus Yoshio UMEZAWA (Univ. Tokyo) • - Prof. Masao SUGAWARA (Nihon Univ.) • - Prof. Koji TOHDA (Univ.Toyama) • - Prof. Philippe BUHLMANN (Univ. Minnesota) • - Prof. Sandra RONDININI (Univ. Milan) • Prof. Marcin MAJDA (UC Berkeley) • - Dr. Hiroaki TAO (AIST) • - Dr. Masaki TORIMURA (AIST) • - Dr. Hiroaki SATO (AIST) • - Dr. Hanna RADECKA (Polish Academy of Science) • - Akiko KITAJIMA, Tsutomu FIJIKAKE • Financial Supports • - MEXT: • Grant-in-Aid for Young Scientists (B) (Nos. 19750068, 21750085) • Grant-in-Aid for Scientific Research Innovative Areas (No. 21106523) • - JST: • Research Grant for Promoting Technological Seeds (No. 04-015) Thank you for your attention!