Download
1 / 17
170 likes | 251 Views
Agenda SADC THEMA Services. PRESENTATION FORMAT Introduction Uses of products Vegetation Indices Rainfall and Water Indices. 1. Introduction: What can you see ?. Field A. Field B.

E N D
Agenda SADC THEMA Services PRESENTATION FORMAT • Introduction • Uses of products • Vegetation Indices • Rainfall and Water Indices
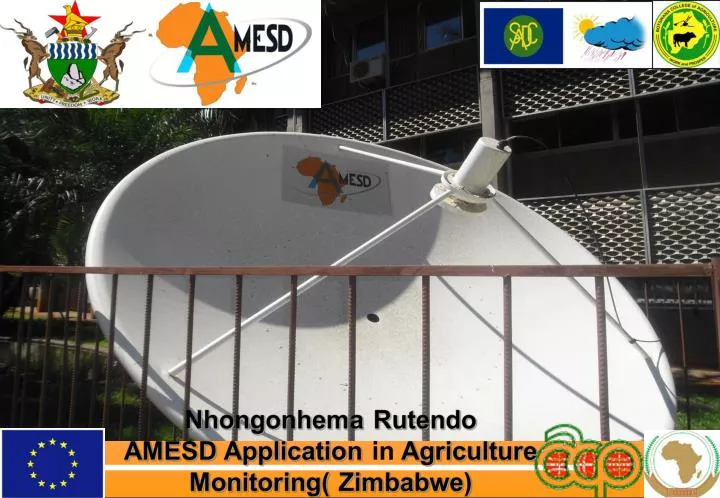
1. Introduction: What can you see ? Field A Field B • Crop Monitoring help farmers and agriculture practitioners to understand the health of the crop, extent of infestation or stress damage, or potential yield and soil conditions
Uses of products to date Use the products for various reports which includes 1.Crop and Livestock Assessment Reports which are sent to cabinet. These are used for: budgetary purposes import and export decisions internal distribution systems Also used by:Donors and NGOs, Farmers, other stakeholders-banks ,companies 2.Food Security Bulletins by the National Early Warning Units
Crop & Livestock Assessments Used for early warning Carries two per season First Round to establish season quality, area planted to different crops, crop and livestock condition as well as grazing condition& water availability Second Round for yield and production estimates. It also updates on the season quality
Vegetation Indices VEGETATION PRODUCTS • These are products based on vegetation reflectance qualities and are visualized using image processing and analysis softwares such as Ilwis, Spirits, Windisp, Agromet Shell, e.t.c.
NDVI • NDVI is a dimensionless index that is indicative for vegetation density. • NDVI values range between -1 and 1 , with dense vegetation and healthy having higher values (e.g., 0.4 - 0.7), and lightly vegetated regions having lower values (e.g., 0.1 - 0.2). • Over the course of a growing season, there is a steady increase in the NDVI values as the young, green crops grow • This increase reaches a maximum value just before it drops suddenly at harvest time • A decrease in MDVI during peak growing season may be used as an early warning sign
NDVI NDVI : Image visualization and Application • E.g Anomaly Map:
NDVI NDVI : Image visualization and Application NDVI 2011 Dec 3rd Dekad NDVI 2012 Jan 3rd Dekad
Dry Matter Productivity (DMP) • DMP, or Dry Matter Productivity, is an indication of the dry matter biomass increase (growth rate) expressed in kg/dry matter/ha/day. • The physical DMP values are between 0 and 327.67 kg dry matter per hectare per day, where higher values indicate more production of dry matter biomass. • DMP is used to assess crop development (growth rate) and crop yield (e.g. for early-warning systems), using mostly the differencing(consecutive images in one season) and cumulative techniques. • DMP images can also be cumulated over time from the start of the season in order to estimate the final dry matter which had been produced by the vegetation over time, which has a direct relationship to yield.
4) Vegetation Indices DMP: Visualization and Application
5) Rainfall and Water Indices RAINFALL and SOIL MOISTURE PRODUCTS
Start of the Season Onset of Season • Compared to long term average
Water Requirement Satisfaction Index (WRSI) WRSI is an indicator of crop performance based on the availability of water to the crop during a growing season. It is crop specific
Soil Moisture Index (SWI) Soil Moisture Index (SMI) is the ability of the soil to supply moisture to the plant.
Future activities This season we will pilot field mapping in selected districts with the help of a partner A sample of households will have coordinates of the field taken and progress monitored using the receiving station products as well as physical monitoring on the ground(validation)
The END Thank You.