Download
1 / 9
100 likes | 310 Views
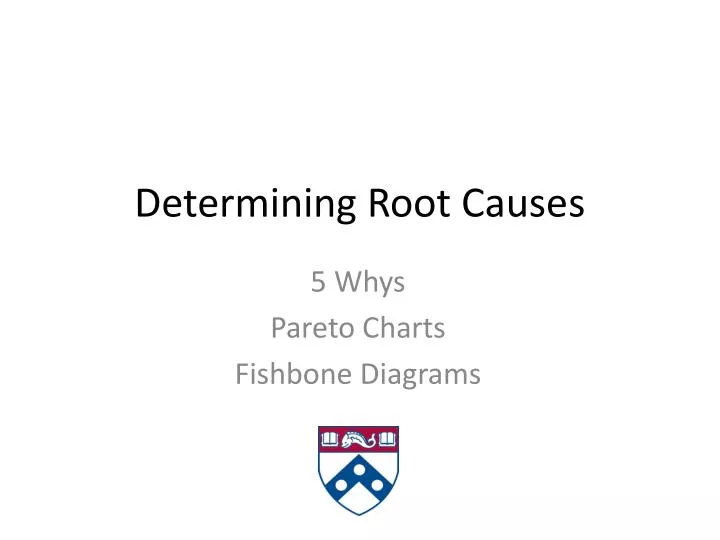
Determining Root Causes. 5 Whys Pareto Charts Fishbone Diagrams. A3 Roadmap for Performance Improvement at Penn Medicine. 5 Whys. The simple idea is to keep asking "Why" (usually five times) to ensure that the root cause(s) to the effects are fully understood.

E N D
Determining Root Causes 5 Whys Pareto Charts Fishbone Diagrams
5 Whys • The simple idea is to keep asking "Why" (usually five times) to ensure that the root cause(s) to the effects are fully understood. • The reasoning is that the result of each time the Why is asked gives a different answer, in essence peeling back the onion as follows: • First Why—Symptom • Second Why—Excuse • Third Why—Blame • Fourth Why—Cause • Fifth Why—Root Cause
Asking “Why 5 Times” Drill Down on Possible Causes Problem: Cement is falling from the ceiling because it is being washed several times a week Why? There are lots of pigeon droppings Why? Pigeons come to eat the spiders Why? Spiders come to eat the midges Why? Midges fly to the flood lights of the monument Why? The lights come on before dusk and attract the midges “Therefore” rule Drill down Turn lights on later
Histogram • A type of bar chart showing a distribution of variables. • Represents each attribute or characteristic as a column and the frequency of each attribute or characteristic occurring as the height of the column RNs Leaving Room During An Episode Of Care - 24 hours
Pareto Chart • A specific type of histogram that ranks causes or issues by their overall influence. A Pareto chart • Assists in prioritizing causes or corrective actions as the issues with the greatest impact are displayed in order. In addition, the Pareto chart • Includes an arc representing the cumulative percentage of the causes. • Pareto’s Law states that a relatively small number of causes will typically produce a large majority of the problems or defects. This is commonly known as the 80/20 rule, where 80% of the problems are due to 20% of the causes.
Cause-Effect or Fishbone Diagrams An Error Dissection Tool for Patient Safety Events A Brainstorming Tool for QI Problems
Fishbone Pitfalls ! • Avoid Never-Ending Possible Causes – Stay within the team’s “sphere of influence”. • Not using data to back up opinions expressed to confirm the true nature of the causes. • Not using experienced facilitators when possible.