Download
1 / 35
360 likes | 506 Views
An Analysis of Statistical Models and Features for Reading Difficulty Prediction. Michael Heilman, Kevyn Collins-Thompson, Maxine Eskenazi Language Technologies Institute Carnegie Mellon University. The Goal: To predict the readability of a page of text.

E N D
An Analysis of Statistical Models and Features for Reading Difficulty Prediction Michael Heilman, Kevyn Collins-Thompson, Maxine Eskenazi Language Technologies Institute Carnegie Mellon University
The Goal: To predict the readability of a page of text. …From far out in space, Earth looks like a blue ball… …Like the pioneers who headed west in covered wagons, Mir astronauts have learned to do the best they can with what they have… … All the inner satellites and all the major satellites in the solar system have synchronous rotation and revolution because they are tidally coupled to their planets…
Outline • Introduction • Lexical & Grammatical Features • Scales of Measurement & Statistical Models • Experimental Evaluation • Results & Discussion
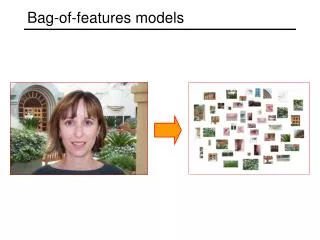
Lexical Features …The continents look brown, like small islands floating in the huge, blue sea…. • relative frequencies of 5000 most common word unigrams • Morphological stemming and stopword removal sea small blue look huge float continent brown island
PP TO NP NN JJ to DT Grammatical Features: Syntactic Subtrees Level 2 Feature Level 1 Feature Includes grammatical function words but not content words. Level 0 Feature S ADJP VP NP
Grammatical Features • Frequencies of the 1000 most common subtrees were selected as features.
S S VP VP NP NP ADJP ADJP N N V V N N S S ADV ADV ADJ ADJ VP VP NP NP DET DET N N V V NP NP DET DET N N Extracting Grammatical Feature Values INPUT TEXT …It was the first day of Spring. Stephanie loved spring. It was her favorite season of the year. It was a beautiful sunny afternoon. The sky was a pretty shade of blue. There were fluffy, white clouds in the sky…. PARSE TREES … FREQUENCIES OF SUBTREES SUBTREE FEATURES …
Outline • Introduction • Lexical & Grammatical Features • Scales of Measurement & Statistical Models • Experimental Evaluation • Results & Discussion
Scales of Measurement • Different statistical models are appropriate for different types of data (scales of measurement). • What is the appropriate scale for readability?
Scales of Measurement apples and oranges Severity of Illness: Mild, moderate, severe, … Years on a calendar Annual income
Statistical Modeling Approaches • Compared 3 standard statistical modeling approaches for interval, ordinal, nominal data. • different assumptions, numbers of parameters and intercepts • More parameters allow more complex models, but may be harder to estimate.
Linear Regression • Well-suited for interval data. • Reading level is linear function of feature values. Single set of parameters for features Single intercept
Proportional Odds Model • Log-linear model for ordinal data Single set of parameters for features Intercept for each level Estimated probability of text being level j: difference between levels j and j + 1.
Multi-class Logistic Regression • Log-linear model for nominal data Set of parameters for features for each level but one. Intercept for each level Sum over all levels
Estimation and Regularization • Parameters were estimated using L2 regularization. • Regularization hyper-parameter for each model was tuned with simple grid search and cross validation.
Hypothesis The Proportional Odds Model using both lexical and grammatical features will perform best. • Difference between reading ability between grades 1 & 2 should be larger than between 10 & 11. • Both Lexical & Grammatical features play a role.
Outline • Introduction • Lexical & Grammatical Features • Scales of Measurement & Statistical Models • Experimental Evaluation • Results & Discussion
Evaluation Corpus • Source: • Content text from set of Web pages. • Reading level labels for grades 1-12: • Indicated by Web page or link to it. • Half authored by students. • Half labeled by teachers or authors. • 289 texts, 150,000 words • Various topics • Even distribution across levels (+/- 3) • Adapted from previous work: • Collins-Thompson & Callan, 2005 • Heilman, Collins-Thompson, Callan, & Eskenazi, 2007
Evaluation Procedure • Randomly split corpus into training set (75%) and test set (25%). • Ten-fold stratified cross-validation on training set for model selection and hyper-parameter tuning. • Test Set Validation: Compared each statistical model & feature set pair (or baseline) to hypothesized best model, the proportional odds model with combined feature set.
Outline • Introduction • Lexical & Grammatical Features • Scales of Measurement & Statistical Models • Experimental Evaluation • Results & Discussion
Comparison of Feature Sets * Proportional Odds Model: Lexical Features Proportional Odds Model: Grammatical Features Proportional Odds Model: Combined Features * p < .05
Comparison of Modeling Approaches * * * * Linear Regression: Combined Features Multi-Class Logistic Regression: Combined Features Proportional Odds Model: Combined Features * p < .05
Comparison to Baselines • Compared Proportional Odds Model with Combined Features to: • Flesch-Kincaid • Implementation of Lexile • Collins-Thompson and Callan’s language modeling approach • PO model performed as well or better in almost all cases.
Findings: Feature Sets • Grammatical features alone can be effective predictors of readability. • Compared to (Heilman et al., 2007), uses more comprehensive & detailed set of grammatical features. • Does not require extensive linguistic knowledge and effort to manually define grammatical features.
Findings: Modeling Approaches • Results suggest that reading grade levels lie on an ordinal scale of measurement. • Proportional odds model for ordinal data lead to the most effective predictions in general. • More complex multi-class logistic regression did not lead to better predictions.
Proportional Odds Model Intercepts • PO intercepts estimate log odds ratio of a text being at or above a level compared to below that level. • Are the intercept values a linear function of grade levels? • Is there value in the ability to model ordinal data?
Null Hypothesis Testing • Used Bias-Corrected and Accelerated (BCa)Bootstrap (Efron & Tibshirani, 1993) to estimate 95% confidence intervals for differences in evaluation metrics for each model from the PO Model with Combined Features. • The bootstrap performs random sampling with replacement of the held-out test dataset to create thousands of bootstrap replications. It then computes a statistic for each replication to estimate the distribution of that statistic.
Bootstrap Histogram Example • Distribution of difference in RMSE between PO model with combined features and implementation of Lexile: A difference of 0.0 corresponds to the null hypothesis
Comparison to Baselines * * * Lexile-like measure (Stenner et al., 1988) Lang. Modeling (Collins-Thompson & Callan, 2005) Flesch-Kincaid Proportional Odds Model: Combined Features * p < .05
Simplified Linear Regression Example 4 Freq. of Adverbial Phrases 3 2 1 Freq. of Embedded Clauses j (Prototypical Text at Level j)
Simplified PO Model Example 4 3 Freq. of Adverbial Phrases 2 1 Freq. of Embedded Clauses j (Prototypical Text at Level j)
Simplified Logistic Regression Example 2 3 Freq. of Adverbial Phrases 1 4 Freq. of Embedded Clauses j (Prototypical Text at Level j)