Download
1 / 59
590 likes | 720 Views
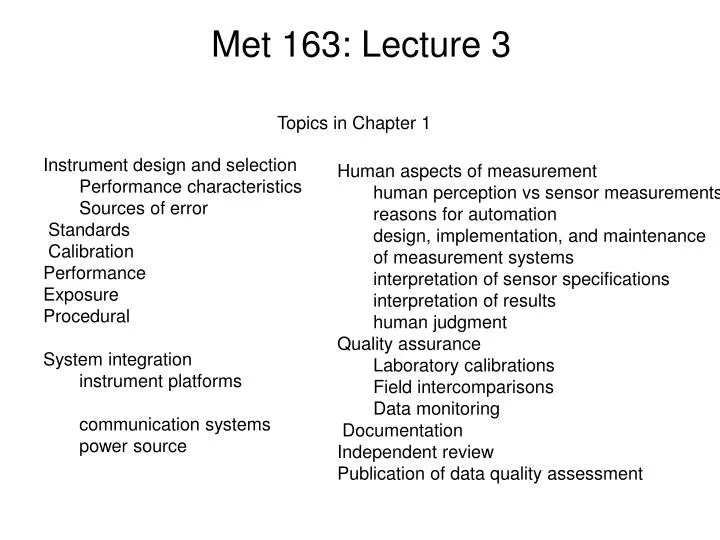
Met 163: Lecture 3. Topics in Chapter 1. Instrument design and selection Performance characteristics Sources of error Standards Calibration Performance Exposure Procedural System integration instrument platforms communication systems power source. Human aspects of measurement

E N D
Met 163: Lecture 3 Topics in Chapter 1 • Instrument design and selection • Performance characteristics • Sources of error • Standards • Calibration • Performance • Exposure • Procedural • System integration • instrument platforms • communication systems • power source • Human aspects of measurement • human perception vs sensor measurements • reasons for automation • design, implementation, and maintenance • of measurement systems • interpretation of sensor specifications • interpretation of results • human judgment • Quality assurance • Laboratory calibrations • Field intercomparisons • Data monitoring • Documentation • Independent review • Publication of data quality assessment
System Integration Design of a measurement system is powerfully affected by considerations other than sensor and data logger choice. Selection of the measurement platform, data communication system, and type of power have a large impact on system design. What does communications mean in terms of weather stations? Communication system limitations may dictate the location of remote sites, forcing compromises in site location. Ideally, data are communicated in real time from the measurement site to a central archiving facility. In some cases, real-time communications are not possible, so data are instead manually located at periodic intervals. Power limitations may prohibit the use of certain types of sensors.
Instrument Platforms Almost every type of instrument platform is used in meteorology since the atmosphere is so extensive and inaccessible! Name some platforms: Instrument shelter Tower (instrument masts, tripod), stick in the ground Balloons Kite Car Buoy Airplanes Rockets Satellites
Eddy-correlation instruments Net radiometer Temp/RH probe Anemometer Sonic Anemometer Data logger(s) Power and Comms 43 m (145 foot) Tower
Aircraft instrumentation Aventech, Inc. AIMMS-20
Communication Systems Access to remote sites and real-time and archived data. Telephone: expensive when using a ‘landline’, cellular telephone technology coupled with decreasing airtime charges allows cell phones to be a viable alternative to phone lines. Direct Radio: radio is cheap and offers flexibility to remote sites. However, the earth’s curvature limits line-of-sight links.
Communication Systems Access to remote sites and real-time and archived data. Telephone: expensive when using a ‘landline’, cellular telephone technology coupled with decreasing airtime charges allows cell phones to be a viable alternative to phone lines. Direct Radio: radio is cheap and offers flexibility to remote sites. However, the earth’s curvature limits line-of-sight links.
Communication Systems Satellite: The first communication satellite that permitted an inexpensive uplink (low power transmitter and simple antenna) was the Geostationary Operational Environmental Satellite (GOES). An inexpensive uplink is essential when a large number of remote stations is involved. In addition, stations may be powered by batteries and solar panels, thereby requiring low-power radio transmitters.
Power Sources Electrical power consumption of a measurement system is often of vital consideration. Primary concern is cost. If the station is located near a commercial power provider (PG&E), then cost is not an issue. BUT, if the measurements are in a remote location, then the power source is usually a battery and solar panel. Battery-powered systems are constrained to select sensors with low power consumption and/or to switch the sensors on only as needed, to conserve power. Heaters (in the instruments) generally cannot be used. Local computations may be limited as well.
Human Aspects of Measurement Automated instrumentation is used to make measurements that humans cannot. For reasons of safety, cost, or performance (speed or accuracy). The measurement systems must be viewed as extensions of the human who wishes to use the data.
Human Aspects of Measurement Human Perception verses Sensor Measurements Humans can directly sense a number of variables such as temperature, wind speed and direction, and solar radiation. Human perception of temperature is influenced by wind speed and solar radiation. Typically, the human observer is superior to instruments in that we can detect subtle influences and perceive patterns in the weather that would be difficult to discern from the worldview filtered through a measurement system. Humans are superior to instruments for some variables such as: precipitation type and visibility, which by definition is the distance that humans can see objects.
Human Aspects of Measurement • Reasons for Automation • Cost: typically, a measurement task can be implemented at a far lower cost by eliminating people (hourly pay) and replacing them with sensors, data loggers, and data communication equipment. • Consider a mesoscale network that requires measurements of 10 variables at 5-min intervals 24 hrs a day, day after day. Each station would require about five, very dedicated people. Their salary alone would be far more than the cost of the usual equipment.
Human Aspects of Measurement Reasons for Automation 2. Performance: Instruments can be located in hostile (to humans) environments and perform tasks difficult of impossible for humans such as recording a number of variables at 0.1 second intervals. In addition, the accuracy of human observations is generally less than that of a well-calibrated and suitably exposed electronic sensor.
Human Aspects of Measurement Eliminating Human Error We expect instruments to make repetitive measurements with only occasional error. In the same task, a human would be soon bored and, consequently, error prone. If well done, automation of measurements can reduce costs, improve sensor performance, and reduce human error. But, there is a trade-off: the loss of involvement of a human observer. The user of the data may not know what type of sensor was used, how representative its location, response of the sensors to extreme conditions, etc…
Human Aspects of Measurement Eliminating Human Error Automation typically causes a vast increase in the volume of data obtained. Measurements are made more frequently from more sensors in more places. Even with the aid of computers and graphics packages it is extremely difficult for a user to examine all of this data and therefore even gross errors may go undetected! Unless automatic data monitoring proceedures are implemented for quality control, automation can easily cause a decrease in data quality!
Interpretation of Sensor Specifications Work through example in textbook. Interpretation of measurements requires involvement of the user, who must judge whether the instrument was properly exposed and whether unusual conditions exist. A measurement that is unusual or unexpected might result from instrument failure or unusual atmospheric conditions. If a temperature is reported to be -273 °C, one can assume that there is an error in the system. The obvious cases can be detected by the quality assurance protocol, but some odd data, outliers, can pass. The user is the ultimate judge.
Quality Assurance Schwartz and Doswell (1991) claim that automation has been accompanied by a decrease in data quality but that this decrease is not inevitable. When a measurement system is automated, some sources of human error are eliminated (personal bias, transcription mistakes incurred while reading an instrument). However, another, more serious form of error is introduced: the isolation of the observer from the measurement process.
Quality Assurance Laboratory Calibrations It is necessary to calibrate sensors in the lab using a standard or reference. Laboratory calibrations are not necessarily a good predictor of how the sensor will perform in the field. Laboratory calibrations never replicate all field conditions: effects of solar and earth radiation, etc. Lab calibrations are fairly easy to implement with the use of a chamber or bath and stirrer.
Quality Assurance • Field Intercomparisons • Two types of field intercomparisons should be performed to help maintain data quality. • A field intercomparison station should be established and • When a technician visits a station, they should carry a portable transfer standard. • The field intercomparison station should comprise of operational sensors and a set of reference sensors (higher quality of sensors).
Quality Assurance Data Monitoring No calibration will provide a real-time indicator of problems in the field. The data acquisition system should have a QA program running to determine data quality This can be an algorithm that scans for outliers and a diagnostic algorithm that infers the cause of the problem.
Quality Assurance Documentation With each site, there is a need to document many aspects of the system. This includes site location and aspects (topographic info: elevation, etc.) Sensors used at the site Calibration coefficients and date of last cals. Development of a database for sensor and site history, etc.
HW#3 Due: 10 Feb. • Select a site on the Mesowest (http://www.met.utah.edu/mesowest/) • Download the data and plot 1 week of data for the following: • Temperature and RH • Wind speed and direction • Pressure • Precipitation • Solar radiation (if available)