Download
1 / 31
310 likes | 313 Views
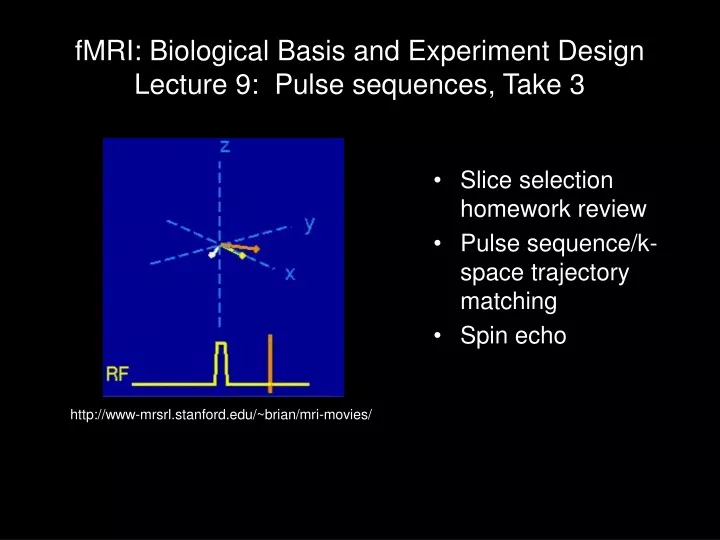
fMRI: Biological Basis and Experiment Design Lecture 9: Pulse sequences, Take 3. Slice selection homework review Pulse sequence/k-space trajectory matching Spin echo. http://www-mrsrl.stanford.edu/~brian/mri-movies/. Protons on water molcules: Ernst's "spies". = B = B

E N D
fMRI: Biological Basis and Experiment DesignLecture 9: Pulse sequences, Take 3 • Slice selection homework review • Pulse sequence/k-space trajectory matching • Spin echo http://www-mrsrl.stanford.edu/~brian/mri-movies/
Protons on water molcules: Ernst's "spies" = B = B = 267 x 106 (rad/s)/T = 42.6 MHz/T
Slice selection - edges aren’t exactly hard f G = 12 mT/m = 1.2 G/cm = * x * G x BW thk = BW/GSS Frequency profile of pulse = spatial profile of slice
Pulse sequence diagram: Nrep = 256 Flip angle = 7 deg. TR = 10ms RF Sequence type: FLASH Contrast: T1 Image resolution: 256 x 256 Total acquisition time: 256 x 10ms = 2.5s Sequence type: ___________ Contrast: ___________ Image resolution: ___________ Total acquisition time: ___________ GSS GPE TE ~ 5ms GRO 256 points DAC
K-space trajectory and scaled T2* decay in gray matter: 256 M … 256 lines time (ms) Tacq = 2.5ms TE = 5ms 4 3 2 1 256 (complex-valued) points
Pulse sequence diagram: TR = 1.5 s Flip angle = 75 degrees RF Sequence type: EPI Contrast: T1 and T2* Image resolution: 64 x 64 Image acq. time: 64 x 0.57ms = 36.48ms Sequence type: ___________ Contrast: ___________ Image resolution: ___________ Image acq. time: ___________ GSS … GPE TE = 30ms (32nd line) … GRO (64 times) Echo spacing = 0.57ms 64 64 64 64 64 64 DAC
K-space trajectory and scaled T2* decay in gray matter: M 64 lines time (ms) … Tacq = 35ms TE = 30ms 64 (complex-valued) points
Image: (resolution) (contrast)
Pulse sequence diagram: TR = 5 s Flip angle = 75 degrees RF Sequence type: ___________ Contrast: ___________ Image resolution: ___________ Image acq. time: ___________ Sequence type: GE EPI Contrast: T2* Image resolution: 64 x 64 Image acq. time: 64 x 0.57ms = 36.48ms GSS … GPE TE = 30ms (32nd line) … GRO (64 times) Echo spacing = 0.57ms 64 64 64 64 64 64 DAC
K-space trajectory and scaled T2* decay in gray matter: M 64 lines time (ms) … Tacq = 35ms TE = 30ms 64 (complex-valued) points
Image: (resolution) (contrast)
Pulse sequence diagram: TR = 5 s Flip angle = 90 degrees RF Sequence type: ___________ Contrast: ___________ Image resolution: ___________ Image acq. time: ___________ Sequence type: EPI Contrast: T2* Image resolution: 128 x 128 Image acq. time: 128 x 0.75ms = 96ms GSS … GPE TE = 55ms (65th line) … GRO (128 times) Echo spacing = 0.75ms 128 128 128 128 128 DAC
K-space trajectory and scaled T2* decay in gray matter: M 128 lines time (ms) … Tacq = 96 ms TE = 55 ms 128 (complex-valued) points
Pulse sequence diagram: TR = 5 s Flip angle = 90 degrees RF Sequence type: ___________ Contrast: ___________ Image resolution: ___________ Image acq. time: ___________ Sequence type: EPI Contrast: T2* Image resolution: 128 x 128 Image acq. time: 96 x 0.75ms = 72 ms GSS … GPE TE = 30ms (32nd line) … GRO (96 times) Echo spacing = 0.75ms 128 128 128 128 128 DAC
K-space trajectory and scaled T2* decay in gray matter: M 96 lines … time (ms) Tacq = 72 ms TE = 30 ms 128 (complex-valued) points
Spin Echo 180 deg. 90 deg. M T2 T2* time (ms)
Pulse sequence diagram: 180 deg. 90 deg. TR = 5 s RF Sequence type: ___________ Contrast: ___________ Image resolution: ___________ Image acq. time: ___________ Sequence type: SE EPI Contrast: T2 Image resolution: 128 x 128 Image acq. time: 96 x 0.75ms = 72 ms GSS … GPE TE = 60ms (32nd line) … GRO (96 times) Echo spacing = 0.75ms 128 128 128 128 DAC
K-space trajectory and scaled T2 & T2* decay in gray matter: M T2 96 lines T2* … time (ms) 90 180 Tacq = 72 ms TE = 60 ms 128 (complex-valued) points
Pulse sequence diagram: Nrep = 4 Flip angle = 40 degrees TR = 0.25 s RF Sequence type: segmented EPI Contrast: T1 and T2* Image resolution: 128 x 128 Segment acq. time: 32 x 0.75ms = 24 ms Image acq. time: 1 sec Sequence type: ___________ Contrast: ___________ Image resolution: ___________ Segment acq. time: Image acq. time: ___________ GSS … GPE TE = 20ms (16th line) … GRO (32 times) Echo spacing = 0.75ms 128 128 128 128 128 DAC
K-space trajectory and scaled T2* decay in gray matter: … M … … … 128 lines time (ms) Tacq,seg = 24ms TE = 20ms 128 (complex-valued) points
Image: But not really ... With the short read-out, the distortion would be much less noticeable. This acquisition had a short TE (using partial Fourier acquisition) but was not a segmented acquisition, so has more distortion than advertised.
Pulse sequence diagram: Nrep = 4 90 deg. 180 180 TR = 2.5 s TI = 0.9 s RF Sequence type: ___________ Contrast: ______________________ Image resolution: ___________ Image acq. time: ___________ Sequence type: IR SE EPI Contrast: T1 and (small amount of) T2 Image resolution: 128 x 128 Image acq. time: 4 x 2.5s = 10 s GSS … GPE TE = 25ms (16th line) … … GRO Echo spacing = 0.75ms … DAC
K-space trajectory and scaled T2* decay in gray matter: … M … … … 128 lines time (ms) Tacq,seg = 24ms TE = 40ms 128 (complex-valued) points
Pulse sequence diagram: Nrep = 176 x 224 TR = 10ms RF Sequence type: ___________ Contrast: ______________________ Image resolution: ___________ Image acq. time: ___________ Sequence type: 3D FLASH Contrast: T1 Image resolution: 256 x 224 x 176 Image acq. time: 176 x 224 x .01s = 6 min 34s GSS GPE GRO 256 points DAC
K-space trajectory and scaled T2* decay in gray matter: M 224 lines time (ms) Tacq = 2.5ms TE = 5ms 176 partitions 256 (complex-valued) points