Download
1 / 36
360 likes | 474 Views
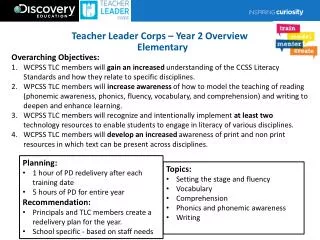
Woodlin Elementary. State of the School Annual Summary of Data and Results leading into the 2011-2012 School Year. Together We Explore, Learn, and Succeed. Woodlin Performance Data. Enrollment Trends Population Demographics mClass Reading Reading benchmark testing-Grades K, 1, 2

E N D
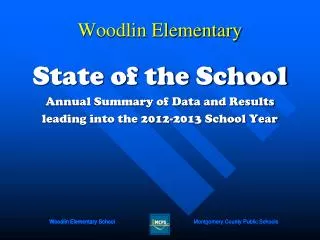
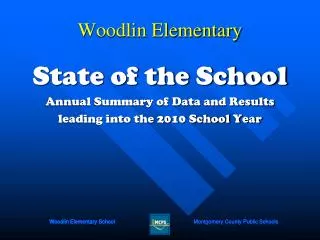
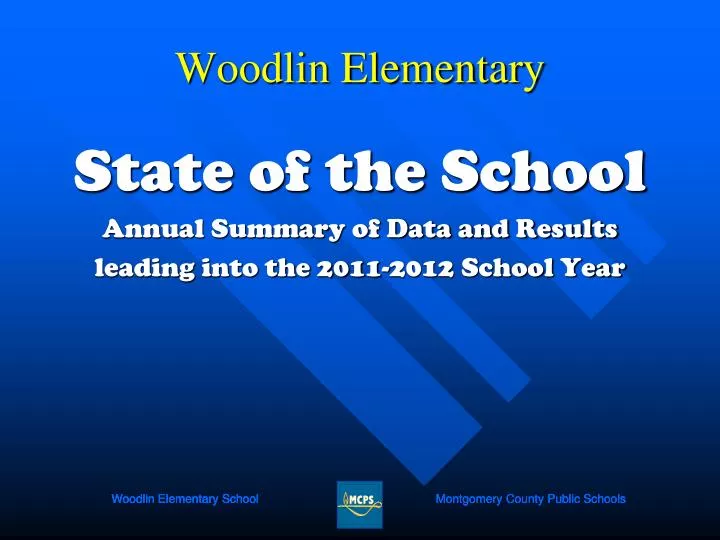
Woodlin Elementary State of the School Annual Summary of Data and Results leading into the 2011-2012 School Year
Together We Explore, Learn, and Succeed Woodlin Performance Data • Enrollment Trends • Population Demographics • mClass Reading Reading benchmark testing-Grades K, 1, 2 • MAP-R Measures of Academic Progress in Reading –Grades 3, 4, 5 • MSA Maryland School Assessment-Grades 3, 4, 5 • Math Unit By course enrollment based on end of year mastery • TN2 Terra Nova Two-Grade 2 • Climate Survey Data Annual survey-staff, random sample of parents, grade 3, 5 students
Spring 2011 MAP-R% Meeting Target RIT for Grades 3-4-5- combined
Reading Math Grade Grade Proficient Proficient Advanced Advanced 3 388 456 3 379 441 4 371 437 4 374 433 5 384 425 5 392 453 MSA Cut Scores
Reading MSA 2011 Next years target of 90.6 Target AMO was 85.9%
Math MSA 2011 Target AMO was 84.5%
Math Unit Mastery by Course: NOT by grade level of enrollment, but for the course taken including on level and advanced students Percent of Students Who Scored at or above 75% for all units combined (end of year data)
Math Unit Mastery by Course: NOT by grade level of enrollment, but for the course taken including on level and advanced studentsPercent of Students Who Scored at or above 75% for all units combined (end of year data)
Selected Celebrations • PRIMARY READING • All grade levels had more than 90% of students meet the reading target! • 1st grade had the highest number of BL/AA students hit the benchmark (97%)! • Kindergarten had the highest number of Hispanic students hit the benchmark (93%)! • 2nd Grade had over a 20% increase in the percentage of students to meet benchmark (from 70% in 2010 to 91% in 2011)!
Selected Celebrations! • MSA Reading • All special education students exceeded the target! • Increase of 14.6% for the percentage of BL/AA students scoring advanced! • MSA Math • Special education performance increased by 15.6% points (from 74.3% in 2010 to 89.9% in 2011)! • Increase of 17.2% of Hispanic students and increase of 5% of FARMs students! • TN2 • All students, and all subtest areas 76-80% of students scored at the 50%ile or higher!
2nd Grade TN2 PerformancePercent of students at or above 50th %ile Target is 70% of students
2011 2nd Grade TN2 PerformancePercent of students at or above 50th %ile Target is 70% of students at the 50th %ile
Student Survey Teachers help when I don’t understand (↑5.5%) Receive prompt feedback on assignments (↑6.0%) Feel welcomed at school (↑15.8) Parent Survey I feel welcomed at this school (↑4.6%) Clear process for addressing concerns (↑8.7%) Atmosphere of open communication (↑4.8%) Climate SurveyHighlighted Gains(Gains greater than 3.0% points)
Student Survey Teachers explain how to do homework (↓3.1%) Can talk to a school administrator about a problem (↓2.5%) Teachers explain things when I don’t understand (↓1.7%) Teasing is a problem (↓6.0%) Parent Survey School does a good job of welcoming families of diverse cultures (↓1.4%) School provides opportunities for parents to be involved (↓1.4%) Climate SurveyHighlighted Areas of Need
Student Survey School staff encourages students to respect others (97.2%) My teachers help me when I don’t understand (96.3%) My teachers have high expectations for me to do well in school (95.3%) Parent Survey Teacher expect my child to do well in class (99.0%) My child feels safe at school (99.0%) I am satisfied with the overall instruction my child receives at this school (99.0%) Climate SurveyTop 3 Areas
Student Survey Students in this school are well behaved (60.7%) I can work in my classroom without being bothered by other students (54.2%) Parent Survey The school has a clear process for addressing my concerns (94.9%) My child’s teacher keeps me informed about my child’s progress (95.0%) It is easy for me to talk to my child’s teacher about things concerning my child (96.0%) Climate SurveyLowest 3 Areas
Strengths (100%) Collaborate w/ colleagues Help & support from colleagues Satisfaction with work Support from administration when working w/ parents Safe place to work Would recommend as a good place to work Relative Areas of Need Amount of non-teaching duties is reasonable (77.8%) I have time during workday to plan instruction for my students (50.0%) System-wide professional development opportunities meet my needs(74.1%) Bathrooms are kept well supplied (55.3%) Climate SurveyStaff Trends: Top 3
Trending upward Climate SurveyTeasing: Percent positive response
Action Items &Next Steps • Effective co-teaching • Relationships and High Expectations!!! • Academic Focus Clubs • Staff development on effective • Inquiry groups on areas of professional growth during staff meetings