Download
1 / 21
210 likes | 314 Views
Disaster Management Framework for Preparedness. Inderjit Claire Vice President RMSI October, 2007. Delivering a world of solutions. Need for Mainstreaming Pre-hazard Risks Management. Frequency and magnitude of losses from natural disasters have been constantly increasing

E N D
Disaster Management Framework for Preparedness Inderjit Claire Vice President RMSI October, 2007 Delivering a world of solutions
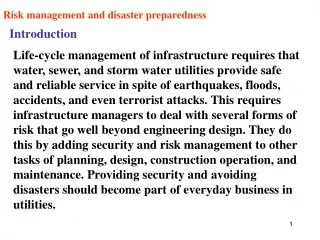
Need for Mainstreaming Pre-hazard Risks Management • Frequency and magnitude of losses from natural disasters have been constantly increasing • Losses from recent natural disasters have been a great deal higher than those that occurred earlier in time • This trend is expected to continue because of an increasing higher concentration of population and property in areas susceptible to natural hazards Losses from major natural disasters world-wide from 1950-2006 (in 2006 $ values) (Courtesy: NatCatSERVICE, Geo Risks Research, Munich Re)
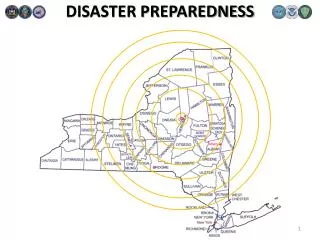
Hazards • Earthquakes • Tsunami • Landslides • Cyclones • Floods • Fire
Risk Assessment Hazard Risk Management Framework Emergency Preparedness • Emergency Response Planning • Exercises • Public Awareness • Communication and Information Management Systems (IMS) • Technical Emergency Response Capacity Institutional Capacity Building • Community Participation • Legislative Framework • Training, Education and knowledge Sharing • Decentralized Emergency Management System • International Cooperation • Catastrophe Risk Financing • Ex-Ante Funding Arrangements • Catastrophe Insurance Pools • Reserve Funds • Contingent Capital Facility • Risk Mitigation Investments • Warning and Monitoring Systems • Hazard Mapping and Land Use Planning • Code Refinement and Enforcement • Hazard Specific Risk Mitigation
Scenario Based Vulnerability Mapping – Earthquake Example • Starts with scenarios, then defines the hazard, then estimates the vulnerability, calculates what is the exposure and finally estimates probable total damage
Disaster Risk Modeling Process Calculating the hazard coefficients for stochastic events generated. • Stochastic Module generates random events from the characteristics of historical events that have occurred in the region. • Hazard Module analyses the hazard coefficients for each geographic region based on various identified perils applicable in the region.
Disaster Risk Modeling Process Calculating the vulnerability and exposure of the area against disasters. • Vulnerability Module focuses on assessment of physical vulnerability of buildings and infrastructure to ground shaking and collateral hazards and social vulnerability of affected population. • Exposure Module involves the tasks of classification and quantification of the exposures at locality, sector, county, community and city levels.
Disaster Risk Modeling Process Calculating the loss from disasters • Damage/Loss Module: Finally, the damage ratio from the vulnerability module is multiplied by the value of the exposed risk at a location to calculate an estimated monetary loss.
At what scale the vulnerability mapping needs to be done At what scale do we need to carry out the vulnerability mapping Vulnerability Vulnerability parameters
Vulnerability has a Spatial Component • Which places are more vulnerable to a hazard? • Which geographical region, socio-economic class etc. • Who are the vulnerable people? • Relative vulnerability among households and individuals • What should be done? • Link to intervention/ adaptation
Social Vulnerability • Coping Ability • Resistance • Resilience • Social Environment • Age • Gender • Ethnicity • Household type • Economic Environment • Income and Assets • Insurance • Debts • Overlay environmental hazard maps with vulnerability maps to determine areas vulnerable to hazards • Add values, weights, factors for each variable in each layer to represent “Total Vulnerability”
Vulnerability Module – Statistical Data Requirements Social Vulnerability Physical Vulnerability • Social vulnerability is the susceptibility of populations to death and injuries - the assessment of which involves casualty modeling to compute mortality and injury rates associated with various catastrophic events • Population Data reflecting the age, gender, ethnicity and household type • Physical vulnerability refers to the degree to which an asset would get damaged or destroyed in a hazardous environment caused by catastrophic events • Physical vulnerability can be for residential and commercial buildings, critical facilities, infrastructure and agriculture
Exposure Module: Use of Statistical Data • Building Use – Residential, Commercial, Industrial • Type of Buildings • Type of Construction – Steel, Concrete, Masonry • Category/Building class • Building Height, No. of floors • Building age • Built up floor area of the buildings • Occupancy Details – Population density Exposure Module calculates how much of the population and buildings are ‘exposed’ to the natural hazard
Residential Exposure in billion rupees Residential exposure at block level in billion rupees Case Study – India Earthquake Model Objective of the Project: The risk modeling involved historical catalog compilation, hazard assessment, vulnerability evaluation, exposure development, and loss analysis. Data Available: • Census Houses data (Block level) • Occupancy wise Census data (District level) • For each block/town total number of residential census houses is calculated from the total number of census houses by applying the percentage of residential census houses computed at district level • Building Attribute data available was State level • Height data was missing for certain areas Results: Various loss results including average annual losses (AAL), loss costs and probable maximum losses (PML) Alternatives used: Remote Sensing techniques were used to generate the unavailable data
Case Study – Romania Earthquake Model Objective of the Project: Design and customization (where appropriate) of a model for damage computation following an earthquake in Romania. Data Available: • Census Houses data (Commune level) • Occupancy wise Census data (Commune level) • Building Attribute (County level) • Height data (Commune level) Results: Various loss results including average annual losses (AAL), loss costs and probable maximum losses (PML) Use of spectral intensity approach which is different for different heights of the buildings.
Case Study: Developing a Disaster Risk Profile for Maldives • Business need • Maldives was among the most severely affected countries hit by the Asian Tsunami on December 26, 2004 • UNDP initiated a study to analyze Maldives’ high level of vulnerability and to avoid the present scale of losses and damage in the future • Recovery and development planning to be based on Disaster Risk Management (DRM) strategy
Hazard Assessment Historical data Tsunami Storm Earthquake SLR Hazard zones Vulnerability Analysis Exposure Physical Social Damages/Losses Affected Population Risk Profiling Hazard Assessment Weights Individual hazards and multi hazard Historical data Risk indices by island Physical Social Risk Profiling Weights Individual hazards and multi hazard Risk indices by island Case Study: Developing a Disaster Risk Profile for Maldives • Solution • Countrywide study: 200 inhabited islands out of a total of 1190 islands - completed in a challenging timeframe of 6 months • Hazards: Tsunami, Earthquake, Storms, Floods, and Climate Change • Vulnerability: Physical and Social • Exposures: Buildings, infrastructure and agriculture • GIS base map developed • GIS and CAT risk modeling integration • Hazard and risk maps developed • Assessments represented on a 5 point ordinal scale
Case Study: Developing a Disaster Risk Profile for Maldives • Benefits • Comprehensive report and base maps generated • Government of Maldives used the report as a key input for planning developmental strategies to mitigate future disasters • First GIS base map of Maldives developed 3-D view of bathymetry of Maldives (depth in meters)
Data Sources • Public records data county, city departments • Census Data • Other sources • Satellite imagery, aerial photos • Administrative boundary maps • Land use/ Land cover maps
Analysis: Land Use wise Distribution of Population Flood Extent
info@rmsi.com www.rmsi.com Delivering a world of solutions