Download
1 / 46
460 likes | 636 Views
Mike Pilling School of Chemistry, University of Leeds. The quality of the air we breathe. UK Air Quality Strategy, 2007.

E N D
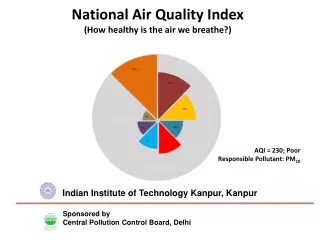
Mike Pilling School of Chemistry, University of Leeds The quality of the air we breathe
UK Air Quality Strategy, 2007 • “Air pollution is currently estimated to reduce the life expectancy of every person in the UK by an average of 7-8 months. The measures outlined in the strategy could help to reduce the impact on average life expectancy to five months by 2020, and provide a significant step forward in • protecting our environment.” • Defra estimate the health impact of air pollution in 2005 cost £9.1–21.4 billion pa.
Synopsis • Particulate matter: trends and origins. • NO2: increases in emissions of primary NO2 and its impact on roadside and kerbside concentrations • Ozone • Air quality and climate change
Particulate matter PM • categorised on the basis of the size of the particles (e.g. PM2.5 is particles with a diameter of less than 2.5μm). • comprises wide range of materials (soot, nitrate, sulphate, organic compounds) • primary particles emitted directly into the atmosphere from combustion sources • secondary particles formed by chemical reactions in the air. • derives from both human-made and natural sources (such as sea spray and Saharan dust) • health effects: inhaled into the thoracic region of the respiratory tract. associated with respiratory and cardiovascular illness
Particulate matter: trends in emissions and measured concentrations (UK) Black smoke, Lambeth, 1961 - 1997 Primary PM10 emissions sources 1970 – 2001 (AQEG: PM report) Annual mean PM10, Urban Background sites AQEG PM report
Air quality – comparison of trends in pollutants Relative annual mean concentration (monthly intervals): selection of monitoring sites in London. AQEG PM report
Analysis of data from 196 sites in UK in 2003 High rural background Small number of rural sites Roadside, urban background and rural annual average PM10 TEOM concentrations in 2003 AQEG PM report
Secondary PM • PM is also formed as a secondary pollutant by chemical reactions in the atmosphere. • This includes oxidation reactions leading to the formation of secondary PM containing: • Sulphate • Nitrate • Organic compounds • The chemistry involved is close to that involved in ozone formation and explains why ozone episodes are accompanied by enhanced PM
PM episodes – other sources • Saharan dust: e.g. 2-3 March 2002. Hourly mean of 292 g m-3 at Plymouth. 1-2 events per year in UK. 23 in Spain! • Sea salt aerosol during gales, especially coastal sites but also inland. 1-5 episodes / year. • Biomass burning: Forest fires in Russia, September 2002. Peak hourly concentrations in were reported on the 12th of September in the range from 70 – 125 g m-3. Biomass plumes, W Russia, 4 September 2002 AQEG PM report
Air Quality Strategy 2007 - PM • Dual approach: • air quality objective/limit value (backstop objective): • PM2.5: annual mean 25μg m-3 by 2020 • Exposure reduction: an objective based on reducing average exposures across the most heavily populated areas of the country: • 15 per cent reduction in average concentrations in urban background areas across the UK between 2010 and 2020
NO2; NOx = NO + NO2 • All combustion processes in air produce oxides of nitrogen • (NOX). • Road transport is the main source, followed by the electricity supply industry and other industrial and commercial sectors. • NO2 is associated with adverse effects on human health: causes inflammation of the airways. Long term exposure may affect lung function and respiratory symptoms. Also enhances the response to allergens in sensitive individuals.
NO2: EU Limit values • Hourly mean: 200 mg m-3, not to be exceeded more than 18 times a year, to be achieved by 31st December 2010. • Annual mean: 40 mg m-3, to be achieved by 31st December 2010.
Maps of annual mean background NO2 concentrations UK 2010 UK 2001 Key AQ objective is annual mean of 40 mg m-3 to be achieved by 2010 (EU Directive)
Air quality – comparison of trends in pollutants Relative annual mean concentration (monthly intervals): selection of monitoring sites in London. AQEG PM report
Trends in annual mean NOx and NO2, roadside and kerbside, 1996 - 2005 NOx, NO2 concentrations Full lines NOx. Dashed lines NO2 • NOx shows downward trend, compatible with improved emissions reduction technologies • This trend is not reflected in NO2. • Measured NO2 / NOx ratio generally increases with time. • Not always the case – e.g. Glasgow Ratio NO2 / NOx
Estimates of f(NO2) based on atmospheric concentrations of NO and NO2 Marylebone Rd All London sites
the percentage of urban major road length predicted to be above 40 g m-3 annual mean NO2 in 2010 for different f-NO2 percentages (shown in brackets).
AQEG conclusions on primary NO2 • Measured NOx concentrations have declined in line with emission changes but NO2 concentrations have not declined as expected, particularly at the roadside and some sites have shown increases in recent years. • Increases in NO2 / NOx ratios could be due to: • increased penetration of Euro-III diesel vehicles fitted with oxidation catalysts • Fitting of catalytically regenerative particle traps to buses Exact interpretation difficult given the observation of increases in the NO2/NOx concentration ratio at only some roadside and kerbside sites outside London. Is London particularly sensitive to direct NO2 emissions, because of its size and emission density? But what about Glasgow? NB more analysis carried out for the sites in London because of the greater availability of data in London. Similar increases in NO2 / NOx observed in other European countries.
Ozone • not emitted directly from any human-made source. Arises from chemical reactions between various air pollutants, NOX and Volatile Organic Compounds (VOCs), initiated by strong sunlight. • formation can take place over several hours or days and may have arisen from emissions many hundreds, or even thousands of kilometres away. • can damage airways leading to inflammatory reactions; reduces lung function and increases incidence of respiratory symptoms • causes damage to many plant species leading to loss of yield and quality of crops, damage to forests and impacts on biodiversity.
Air Quality Standards: Ozone • European Union Limit Value: Target of 120μg.m-3 (60 ppb) for an 8 hour mean, not to be exceeded more than 25 times a year averaged over3 years. To be achieved by 31 December 2010. • UK Air Quality Objective: Target of 100μg.m-3 (50 ppb) for an 8 hour mean, not to be exceeded more than 10 times a year. To be achieved by 31 December 2005.
Methane oxidation • CH4 + OH (+O2) CH3O2 + H2O • CH3O2 + NO CH3O+ NO2 • CH3O + O2 HO2 + HCHO • HO2 + NO OH + NO2 • HCHO + OH (+O2) HO2 + CO + H2O • HCHO + hn H2 + CO • HCHO + hn (+2O2) 2HO2 + CO • Note: • 2 x(NO NO2) conversions • HCHO formation provides a route to radical formation.
General oxidation scheme for VOCs • O3 + h O1D + O2 • O1D + H2O 2OH • OH+ RH (+O2) RO2+ H2O • RO2+ NO NO2+ RO • RO HO2(+R’CHO) • HO2+ NO OH +NO2 • NO2+h NO + O; O + O2 O3 • OVERALL • NOx + VOC + sunlight ozone • The same reactions can also lead to formation of secondary organic aerosol (SOA)
Timescales of ozone chemistry • Global chemistry. Dominated by NOx + CH4 + sunlight. Timescales are long as are transport distances. • Regional chemistry. • Many VOCs are emitted, e.g. over Europe. Each has its own lifetime governed by its rate constant for reaction with OH. The timescales of ozone production takes from hours to days. The transport distance for a wind speed of 5 m s-1 and a lifetime of 1 day is ~500 km. • In cities, there are high concentrations of NO from transport sources. Ozone is depressed by the reaction: NO + O3 NO2 + O2
Ozone mixing ratios at MaceHeadW. Ireland, under westerly airflows
Local effects – Ozone depression due to reaction with high concentrations of NO in London. Transect of ozone concentrations
Monitoring stations in Europe reporting high band concentrations of ozone >15 000 ‘excess deaths’ in France; 2000 in UK, ~30% from air pollution. Temperatures exceeded 350C in SE England. How frequent will such summers be in the future? Heat wave in Europe, August 2003
Future summer temperatures • Using a climate model simulation with greenhouse gas emissions that follow an IPCC SRES A2 emissions scenario, Hadley Centre predict that more than half of all European summers are likely to be warmer than that of 2003 by the 2040s, and by the 2060s a 2003-type summer would be unusually cool • Stott et al. Nature, December 2004 2003: hottest on record (1860) Probably hottest since 1500. 15 000 excess deaths in Europe
Global-average radiative forcing (RF) estimates and ranges in 2005(relative to 1750) for anthropogenic GHGs and other important agents and mechanisms Climate change and air quality
Air Quality and Climate Change • UK Air Quality Strategy (2007) • The Government’s environmental policies will be developed with a consideration of their impact on climate change and greenhouse gas emissions, and this is particularly true of air quality. • Where practicable and sensible, synergistic policies beneficial to both air quality and climate change will be pursued. • Where there are antagonisms, the trade-offs will be quantified and optimal approaches will be adopted.
Examples of difficult issues in assessing impact of emissions on climate change and air quality • Diesel vehicles: • Need a more complete assessment of savings of CO2 emissions for diesel vs petrol • Difficulties of defining metrics for black carbon emissions (absorptive aerosol) for climate change and in assessing the air quality (health) impacts relative to climate change impacts of CO2 reduction. • Ozone precursors: • NOx emissions impact on global CH4 and O3, both of which are greenhouse gases. Effects are of opposite sign • VOC emissions from biofuel crops could enhance episodic ozone, especially as temperatures rise.
Air Quality Expert Group Acknowledgement