Download
1 / 51
520 likes | 644 Views
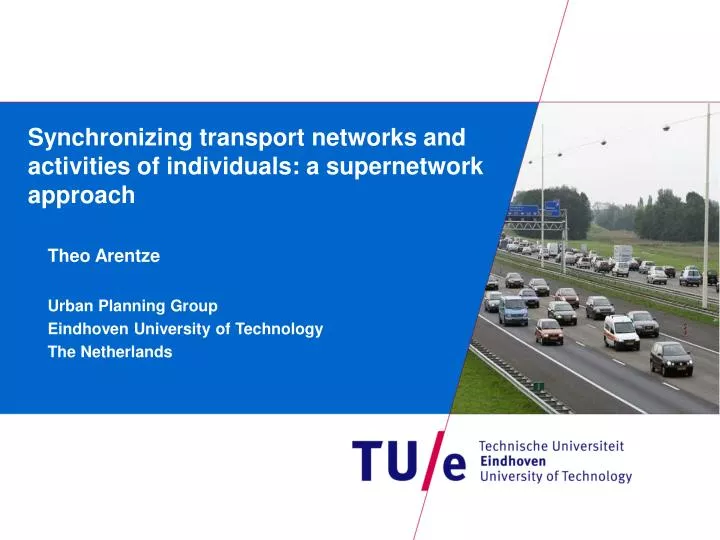
Synchronizing transport networks and activities of individuals: a supernetwork approach. Theo Arentze Urban Planning Group Eindhoven University of Technology The Netherlands. SAR project – synchronizing networks. TU Delft Coordination (E. Molin)

E N D
Synchronizing transport networks and activities of individuals: a supernetwork approach Theo Arentze Urban Planning Group Eindhoven University of Technology The Netherlands
SAR project – synchronizing networks • TU Delft • Coordination (E. Molin) • Postdoc project: scenario development (W. Bothe, J-W v.d. Pas) • PhD project: user behavior (C. Chen, C. Chorus, E. Molin, B v Wee) • TU Eindhoven • PhD project: modeling supernetworks (F. Liao, T. Arentze, H. Timmermans) • University of Nijmegen • PhD project: governance (S. Levy, K. Martens, R. Vd Heijden)
Outline • Activity-based approach • Supernetwork model • Rotterdam case study – illustration of an application • Outlook – new issues and research topics • Conclusions
Travel demand models Aggregate models Micro simulation models Activity-based models Tour-based models Daily activity-patterns Predicting people’s response to policies is notoriously difficult Trip records OD trip matrix Dynamic/static traffic simulation/assignment models
Travel demand models Aggregate models Micro simulation models New model development started in early nineties Activity-based models Trip/tour-based models Daily activity-patterns Models are now making the transition to practice Trip records OD trip matrix Dynamic/static traffic simulation/assignment models
Activity-basedversus trip-basedapproach Trip-based Activity-based Focus is on trips Focus is on activities Unit is a trip Unit is a day Space-time constraints ignored Space-time constraints taken into account Low resolution time and place High resolution time and place Decision unit is individual Decision unit is household Predicts when, where, transport mode Predicts which activities, when, where, for how long, trip-chaining and transport mode
Advantages of the activity-based approach • Better predictions • Sensitivity to broader range of policy scenarios • Higher level of precision in time and space • Transparency – models tell the full story
Approaches • Constraints-based • Stems from time geography (Hagerstrand) • Basic concept is space-time prisms • Purpose is accessibility analysis – not prediction • Examples: Carla, Mastic • Nested-logit models • Extension of trip and tour-based models • Started with the work of Bowman and Ben Akiva (2001) • Rather course classification of activities and modes
Approaches - continued • Activity-scheduling models • Take scheduling process and constraints into account • Utility-based models versus rule-based models • Some pioneering models • Famos, Albatross, Cemdap, Tasha, Adapts • Simulation / optimization models • Traffic oriented models (Transims, Matsim) • Operations Research models (Happs) • Supernetwork models
Synchronizing networks • Can we improve accessibility by synchronizing networks? • Existing capacity of networks stays the same • Better mutual adjustment • Between networks of different modalities • Vis-a-vis locations of people’s activities • Virtual links – ICT • Synchronization = all you can do to improve accessibility without increase of capacity • What is accessibility?
Accessibility How much does it costs to implement a given activity program? Preferences and choice behavior of people need to be taken into account
Which planning and policy measures? • Synchronization • Frequencies and time tables of public transport • Transfer locations – e.g., P + R • Facilities at or near stations and stops • Facilities at work places, etc. • ICT facilities (teleworking, internet facilities) • Spatial development near nodes of transport networks
Goal of the proposed supernetwork model • Integrated approach • Spatial development / Transport / ICT • Multimodal networks • Complete activity programs • Transparancy • Individual approach – micro-simulation • Very high level of detail The new tool is sensitive to synchronization strategies
Traditional concept: multi-modal networks supernetwork Transfer locations A path is a multimodal trip
Go by bike to bus stop Take the bus Work activity Take bus Shopping Take bike Bicycle back home Liao, F.
Example of a schedule 1. Besluit om met fiets te gaan 2. Kiest parkeerplaats voor fiets 3. Reist met bus lijn 1 4. Stapt over op bus lijn 3 5. Loopt naar werk locatie 6. Werk activiteit 7. Terugweg (buslijn 1 en 3) 8. Haalt fiets van parkeerplaats 9. Kiest een winkellocatie 10. Fietst terug naar huis
Example of a schedule Simultaneous choice of • Modes and transfers • Routes • Parking places • Activitity locations For a complete trip-chain (a tour) Schedule is consistent Very high level of detail Decisions are based on utility maximization
Choice experiments: preference measurement Edge of city center Trade-offs? Comprehensive large-scale experiments have been conducted
Rotterdam case study Liao, F., T. Arentze, E. Molin, W. Bothe Illustration of an application An activity-based supernetwork model
Synthetic population Total: 21,117 agents Activity programs were taken from a survey Corridor: 2.5 million residents (2009) Agents : Residents = 1 : 118
Activity programs • Average per person • 2.46 activities per day • 1.57 tours per day
P + R locations • P+R locations (9 in R’dam) • Train stations (10 locations ) • Actual tariffs
Public transport upgrades New tram line has stop in Rdam stadion station High frequent trainsbetween Randstad cities
Increase parking price at activity locations Parking costs double
Spatial developments – realistic • Shopping • Going out • Culture • Sports
Spatial developments – city center • Shopping • Going out • Culture • Sports All concentrate in city center
Spatial developments – near nodes • Shopping • Going out • Culture • Sports Concentrate near transport nodes
Example of a case • An individual lives North-east of center and has a non-daily shopping activity on the agenda
Example of a case The person considers five options - three close to home and the other two in Rotterdam center
Example of a case Before spatial development, the person always takes bike and does shopping at the same postcode area Bike
Example of a case After city center investment, the personswitches to use car, parks car at P+R Capselsebrug and then takes PT to center Car PT
Total costs (disutility) of implementing activities Entire area Baan Tram Real Node Stadion Park City Work City scenario biggest utility improvement PT upgrades improve utility Parking price increase causes strong decline in utility
Total car kilometers Rotterdam PT upgrades no influence With Park car kilometers decrease With Real car kilometers increase With City car kilometers decrease Baan Tram Real Node Stadion Park City Work
Transport mode choice (R’dam) Park decreases car in favor of P+R and bike City decreases car use the most and increases PT use Baan Tram Real Node Park increases P+R considerably Stadion Prijs City Work
Number of people making use of P+R Entirearea Park – strong increase P+R City causes decrease in P+R use Rotterdam More often entire trip by PT Node leads to most P+R use Baan Tram Real Node Stadion Park City Work
P+R use – for which activities? Used most often for working and shopping trips Work trips react more strongly to parking price Spatial development has an impact PT upgrades have minor impact Baan Tram Real Node Stadion Park City Work
Some findings (1) • Upgrade of public transport – frequency and new connections • Improvement of utility, decrease of travel time. Small influence on patterns • Parking price increase • Big influence on P+R use • Relatively big influence on public transport use • Influence on location choice? – still to be looked at
Some findings (2) • Spatial developments • Big influence on utility – City the most • Big increase in travel distance – Node the least • Big increase in travel time – Real the most • Real increases car use – City decreases car use and increases PT use • City least P+R use – Node most P+R use • P+R use • Particularly for work and shopping trips • PT upgrades have little influence • Parking price has big influence • Spatial development has influence – City decreases P+R, Node increases P+R
Are synchronization strategies effective? • Some preliminary conclusions • To support P+R use costs advantage seem important to compensate for the inconvenience of the transfer • Integrated spatial and transport planning pays-off: spatial developments need to be planned simultaneously with transport networks • Further research needed: • What synchronisation measures are effective • To what extent are they effective to achieve accessibility goals?
Conclusions – supernetwork model • Activity-based approach • Complete activity programs • Preferences of travelers are taken into account • Locations, modes, transfers, etc. • Integrated approach • Spatial / Transport / Pricing / ICT • Multimodal networks • Transparency • Micro-simulation - individual approach • Very high degree of detail and coherence
Trends and developments in society • ICT revolution • Social media • Augmented reality • Mobile traveler information systems • Flexible work times and work places • New modes of transport • Electrical vehicles (bicycles, cars) • Car sharing • Multi-modal transport networks
Trends and developments in society – cont’d • New modes of traffic management • Individual / personalized • New requirements and concerns • Ageing population • Transition to renewable forms of energy • Urbanization – scarcity of space • Quality of life – air quality, health, mobility • New methods of data collection and Big Data • GPS-based survey technology • Smart phones • Social media
Conclusions overall • Activity-based models show a large diversity of approaches • New GPS-based survey technology and Big Data offers new perspectives • An important current objective of the field is to develop dynamic models (longer time frames)
Thank you for your attention Questions
Literature references Activity-based modeling • Arentze, T.A., H.J.P. Timmermans (2004) A Learning-Based Transportation Oriented Simulation System, Transportation Research B, 38, 613 - 633. • Arentze, T.A. and H.J.P. Timmermans (2009), A Need-Based Model of Multi-Day, Multi-Person Activity Generation, Transportation Research B, 43, 251-265. • Auld, J., A. Mohammadian (2011) Planning-Constrained Destination Choice in Activity-Based Model, Transportation Research Record, 2254 / 2011, 170-179. • Balmer, M., K.W. Axhausen, K. Nagel (2006) Agent-Based Demand-Modeling Framework for Large-Scale Microsimulations, Transportation Research Record, 1985 / 2006, 125-134. • Bhat, C.R., J.Y. Guo, S. Srinivasan, A. Sivakumar (2004) Comprehensive Econometric Microsimulator for Daily Activity-Travel Patterns, Transportation Research Record, 1894 / 2004, 57-66. • Bowman, J.L., M.E. Ben-Akiva (2001) Activity-based disaggregate travel demand model system with activity schedules. Transportation Research Part A, 38, 1-28. • Pendyala, R.M., R. Kitamura, A. Kikuchi, T. Yamamoto, S. Fujii (2005) Florida Activity Mobility Simulator: Overview and preliminary validation results. Transportation Research Record, 1921 / 2005, 123-130. • Roorda, M.J. and B.K. Andre (2007) Stated Adaptation survey of activity rescheduling: Empirical and preliminary results. Transportation research Record, 2021, 45-54. Survey technology • Ettema, D., T. Gärling, L.E. Olsson and M. Friman (2010) Out-of-home activities, daily travel, and subjective well-being. Transportation Research Part A, 44, 723-732. • Rieser-Schüssler, N. (2012) Capitalising modern data sources for observing and modelling transport behaviour. Transportation Letters, 4, 115-128. • Moiseeva, A., J. Jessurun and H.J.P. Timmermans (2010) Semi-automatic imputation of activity-travel diaries using GPS traces, prompted recall and context-sensitive learning algorithms. In: Proceedings of the 89th TRB Annual Meeting. Washington, D.C.: (CD-Rom, 13 pp.).