Download
1 / 56
580 likes | 863 Views
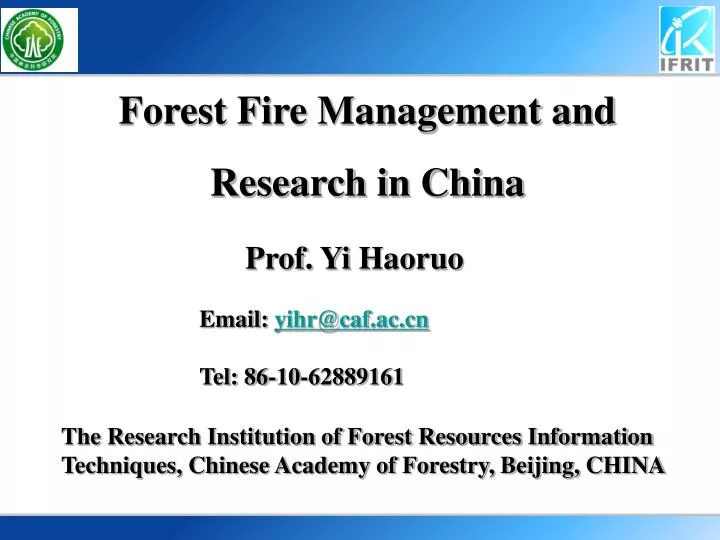
Forest Fire Management and Research in China. Prof. Yi Haoruo. Email: yihr@caf.ac.cn Tel: 86-10-62889161. The Research Institution of Forest Resources Information Techniques, Chinese Academy of Forestry, Beijing, CHINA. OUTLINE. 1. Forest Fire Management 2. Forest Fire Research

E N D
Forest Fire Management and Research in China Prof. Yi Haoruo Email: yihr@caf.ac.cn Tel: 86-10-62889161 The Research Institution of Forest Resources Information Techniques, Chinese Academy of Forestry, Beijing, CHINA
OUTLINE 1. Forest Fire Management 2. Forest Fire Research 3. Operation
1. Forest Fire Management 1.1 Forest Fire in China 1.2 Forest Fire Monitoring System 1.3 Organization Structure 1.4 Instruments
Total Chinese Land Area: 9 600K sq.km Forest Area: 2 080K sq.km Forest Fire Management is a huge mission for the government, community, and researchers in China
1.1 Forest Fire in China (July 28,2002, Da Xing’anling, Inner Mongolia ) Damaged Forest Area: 13,800ha
1.1 Forest Fire in China (May 17, 2003, Heihe, Heilongjiang province ) Burned Area:319,253ha, Damaged Forest Area:248,729 ha
Number of Forest fire in China Times 1.1 Forest Fire in China
Annual Burned Area of Forest Fire 1.1 Forest Fire in China
1.2 Forest Fire Monitoring System FY Satellite Space Airplane Airborne Near Ground Fire Watch Tower Video Watch man Ground
1.3 Organization Structure State Forestry Administration National Forest Fire Prevention Headquarters National Forest Fire Prevention Office Armed Forest Police Headquarters Forest Fire Prevention Headquarters of Province Forest Fire Prevention Office of Province Forest Fire Warning and Monitoring Information Center of SFA General of Heilongjiang, Inner Mongolia, Sichuan, Yunnan, etc. Aerial Forest Protection Center of Northeast Aerial Forest Protection Station Forest Fire Prevention Office of City level Coordination Center of Forest Fire Prevention Aerial Forest Protection Center of Southwest Forest Fire Prevention Office of City-level Sub-center of Forest Fire Monitoring using Satellite Coordination Center of Forest Fire Prevention of Southwest Forest Fire Prevention Headquarters of County-level Division Material Reserves Center of Beijing, Northeast and Southwest Forest Fire Prevention Office of County-level Group Detachment Forest Fire Company Aerial Forest Protection Station Forest Fire Prevention Inspection Station
1.4 Instruments • Satellite Received Station
1.4 Instruments • Aerial Forest Protection FY (About 30 aerial forest protection Station) • Ground
2. Forest Fire Research 2.1 Forest Fire Risk Prediction 2.2 Forest Fire Monitoring 2.3 Burned Area Mapping 2.4 Carbon Emission Monitoring
2.1 Forest Fire Risk Prediction • Purpose • National/Regional-level prediction on forest fire risk • To get the forest fuel types of China. • To get the method to estimate the Relative Greenness. • To get the method to estimate the Fuel Moisture Content. • To get the methodology of forest fire danger rating System.
2.1 Forest Fire Risk Prediction Forest Distribution Administrative Boundary Remote Sensing Data Forecast Data Observation Data on Fire Danger Meteorological Observation Data …… GIS Satellite-Data Network Public Network FT RG FMS Prediction Models Results FT: Fuel Type RG: Relative Greenness The flowchart of Forest Fire Risk Prediction FMC: Fuel Moisture Content
Fuel Types 250m Spatialresolution: 1km
Fuel Greenness Estimation Relative Greens, Spatial Resolution 1Km (2001,9.23~9.30)
Water absorb • Forest Fuel Moisture Content Reflectivity – Waver Length Spatial Resolution : 1KM (2001,9. 23~9.30)
2.2 Forest Fires Monitoring • Purpose • Todetect burning in the vast forest areas • Tomapping large fires for fire suppression • To monitor all phases of a fire in the key regions • To get the fire distribution pattern using satellite data
2.2 Forest Fires Monitoring • Satellite Data • NOAA-AVHRR Data (1.1km) • MODIS Data (1.0km) • ENVISAT-AATSR Data (1.1km) • TM/ETM+ (30m) • SPOT 5 (10m) • FY 3A/B (1.0 km) • HJ-1B (150M)
MIR TIR MIR TIR • Fire Character of Channel High temperature; RadMIR> RadTIR
Results: Detecting the burning over Heilongjiang province in northeast of China
Results: monitoring all phases of a fire in the key regions Fire image, Heilongjiang, May 21~31, 2006
Results May 26 May 22 May 30 May 31 Fire image, Inner Mongolia and Heilongjiang, 2006, Terra/MODIS
Results: using various data from different sensor HJ-1B IRS FY3A VIRR
Fireline Extraction Results: mapping large fires for fire suppression April 29, 2009, ETM, Spatial Resolution:30meter
Fire Distribution Pattern • To get the spatial and temporal distribution pattern
Fire Distribution Pattern Annual total fire point by province, MODIS Data
Fire Distribution Pattern Monthly total active fire counts belong to broadleaf forests for years 2000 - 2011
2.3 Burned Area Mapping • Purpose • To map burnt area borderline using satellite image • To evaluate the damage by forest fires
2.3 Burned Area Mapping Satellite Data Image processing Boundary Extracting Burned Information Enhance GIS Databases (Forest Map, DEM, etc.) Burned Area Maching, Overlay Analysis Burned Forest Type Burned 3D Visualize Damage The flowchart of Burned Area Mapping
Pingxiang City, GuangXi 2.3 Burned Area Mapping • Field Picture
2.3 Burned Area Mapping • Field Picture Burning After Deforestation
2.3 Burned Area Mapping • Satellite Data • NOAA-AVHRR (1.1Km) • MODIS (250m) • ENVISAT-MERIS (300m) • FY 3A/B MERSI (250m) • HJ-1A/B CCD (30m) • CEBERS CCD (20m)
Burned Mapping Results Burned Area Russia China Red: 0.71m (9) Green: 0.89 m(14) Blue: 0.51 m (4) MERIS, Oct. 25,2005, Spatial resolution 300meter
Burned Mapping Results CBERS-2B, March 17, 2008, Spatial resolution:20meter
Burned Mapping Results HJ-1A CCD, Oct. 5, 2009
R=1 G=2 B=1 • Damage Assessment Results MODIS 8 Day Composition (Sep. 14~ 21,2001)
Damage Assessment Results A Result of Red-NIR Space Change Vector Method
Damage Assessment Results Burned Severity(2006.6.2~6.10,MODIS)
Damage Assessment Results HJ 1A-CCD, Oct. 5, 2009.
2.4 Carbon Emission Monitoring • To adapt a monitoring technique to carbon emissions (CO/CO2) from forest fires by using ENVISAT-SCIAMACHY images
CO column data product (v0.6) CO2 column data product (v1.0) SCI_NL_2PP* Average CO2 column before Forest Fire Average CO column before Forest Fire CO column After Forest Fire CO2 column After Forest Fire Interpret to (1º*1º) CO2 Emission Interpret to (1º*1º) CO Emission CO Emission CO2 Emission 2.4 Carbon Emission Monitoring Flowchart of Carbon Emission Estimation
Biomass Burning Estimation • To get the Fire Radiative Energy (FRE) by Biomass Burning FRE =fire duration.<FRP> =d. <FRP> = f(d, m, c, FRPmax, FRPmin) Burned Biomass (g/m2)= k . FRE (J/m2) k≈368