Download
1 / 84
840 likes | 985 Views
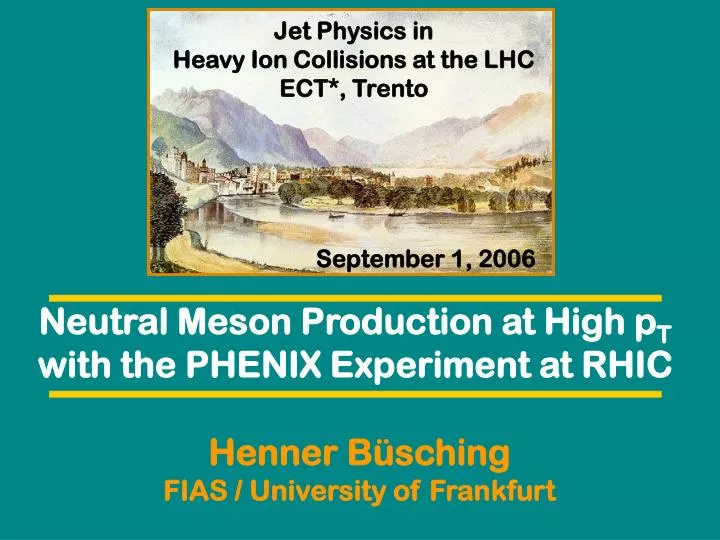
Jet Physics in Heavy Ion Collisions at the LHC ECT*, Trento. September 1, 2006. Neutral Meson Production at High p T with the PHENIX Experiment at RHIC. Henner B ü sching FIAS / University of Frankfurt. The other famous “workshop”…. Council of Trent 1545-1563 = 18 Years !.

E N D
Jet Physics in Heavy Ion Collisions at the LHC ECT*, Trento September 1, 2006 Neutral Meson Production at High pT with the PHENIX Experiment at RHIC Henner Büsching FIAS / University of Frankfurt
The other famous “workshop”… Council of Trent 1545-1563 = 18 Years ! response to the theological challenges of the Protestant Reformation Let’s hope we come to conclusions a lot faster! !
Introduction: A case study The Physics h The Analysis The Challenges p0
A Good General Case Study: The p0 Analysis in PHENIX • The observables: • Important part of one of the first PHENIX papers (paper #3) • Highest citations of all PHENIX papers: • Phys.Rev.Lett.88:022301,2002 : Spires 335 citations • Phys.Rev.Lett.91:072301,2003 : Spires 258 citations • PHENIX is analysing p0 for 6 years now • p0 analysis one of the PHENIX working horses • It still needs some time to publish Fast first results High impact Long experience Established analysis scheme New challenges with every run
Successful analysis series • Running long enough for critical review • What can we learn ? Fast first results High impact ? Why? How? What? Long experience Established analysis scheme New challenges with every run A Good General Case Study: The p0 Analysis in PHENIX
Fast first results High impact The p0 Analysis in PHENIX • In principle a simple analysis • Self calibrating • Self identifying • Experience from previous experiments • PbGl detector re-used from WA98 • Two independent detectors • Two analysis groups – cross check • Strong discovery • Predictions available at start • Theory-friendly (easy to calculate) • Identified particle • High pT
The p0 Analysis in PHENIX Long experience • Calorimeter “veterans” from previous experiments • New expertise developed in PHENIX • Human resource development • Young people start • Experienced people can move on • No gaps in analysis strategy • High interest from non pure p0 analyses • Direct photon • Spin • Correlations • Guarantees fresh ideas and critical perspective • Different reaction systems / energies • New data sets – changing detectors Established analysis scheme New challenges with every run
h The Physics p0
First years : main discoveries 1 2 3 g p0 Phys. Rev. Lett. 91, 072301 (2003) Phys. Rev. Lett. 91, 072303 (2003) Phys. Rev. Lett. 94, 232301 (2005)
Are we done? – No • Improve p+p reference • New Data: • Better Centrality dependence • Higher pT reach • System size dependence • Energy dependence • Particle species dependence • Better Understanding of : • Influence of initial state effects • Influence of final state effects
Neutral mesons in PHENIX p+p d+Au Au+Au Cu+Cu 22.4 GeV 62.4 GeV 130 GeV 200 GeV Reference sQGP ? Comp. p0 h Run 6
The h Meson Signal • h can be measured at high pT in PHENIX • pT (h, p0) ≥ 1 GeV/c • bulk: GeV/c • Should hadronize in vacuum • Neutral meson with 4 x mass of p0 • Second largest source for • decay photons • decay e ± • Important for • direct photon • single electron + dielectron Background
p0 p+p reference Run5 Data h PHENIX preliminary Run3 Data
Initial state effects p0 No strong initial-state effects !
Run4 Data p0 spectra Cu+Cu 200 GeV 56 M min-bias events 1.9 M high-pT events 2.2 B sampled • Au+Au 200 GeV • Luminosity 241b-1 (sampled) • 1.5B events Run5 Data
h spectra Run2 Data (New) PHENIX paper ! nucl-ex/0601037 • Au+Au 200 GeV • 34 M minimum-bias events • + 30 M high-pT • (LVL2 events) sampled
RAA in AuAu at 200 GeV g Run4 0 Data p 0 h Photons are not suppressed p0 and h even at high pT suppressed Suppression is flat at high pT !
p0 and h Au+Au d+Au p+p Similar suppression pattern p0 and h h/p0 ~ 0.4 - 0.5. in all systems and for all centralities Universal suppression for light mesons Suppression at partonic level before fragmentation !(?) !
RAA – Reaction systems p 0 Au+Au Cu+Cu Au+Au 30-40 %, NPart = 114.2 Cu+Cu 0-10 %, NPart = 98.2 Similar suppression at similar NPart Systematic comparison possible !
RAA – Reaction systems Steeper slope at low Npart !
Cu+Cu @ 22.4 GeV p 0 • Close to SPS Energies • p+p data at 21.7 – 23 GeV • Use of parameterization as reference • 3 days of RHIC Run5 • 6.8M Events after quality cuts • Centrality via PC1 multiplicity
p 0 RAA – Energy dependence Vitev nucl-th/0404052 Au+Au pp ref: D. d’Enterria Cu+Cu dNg/dy=650-800 Vitev nucl-th/0404052 62 GeV 22.4 GeV Now we can study influence of collision energy on scaling behavior !
Reaction Plane dependence RAA(Df,pT) RAA(pT)
p/2 0 Reaction Plane dependence Multiplied by inclusive RAA Au+Au – 200 GeV
h p0 The Analysis
The Basics p0 • Mass • 135.0 MeV • Decay Modes • 2g 98.8% • e+e- g 1.2% • Mean life • 8.4*10 -17 sec • cτ = 25 nm • 40 times nuclear radius • leaves collision zone before it decays • 1/250,000 BBC resolution • decays at measured vertex position
PHENIX Central Arm • p0,h via p0,h gg: • Lead-scintillator calorimeter • Lead-glass calorimeter • Centrality, vertex • Beam-Beam Counter (BBC) 3.0 < |h| < 3.9 • Zero-Degree Calorimeter g p0,h g (pseudorapidity |h| < 0.35)
The EMCal Detector PbSc Super Module PbGl Sector
The Lead Scintillator PbSc tower 66 sampling cells 1.5 mm Pb, 4 mm Sc penetrating wavelength shifting fibers for light collection PbSc towers: 5.52 x 5.52 x 33 cm3 (18 X0) 6 sectors with 15552 blocks total
The Lead Glass Calorimeter Lead glass blocks 4 x 4 x 40 cm3 (14.4 X0) 2 sectors with 9216 blocks total
Measuring Photons PbSc • Electrons and Photons: • Bremsstrahlung, pair production • Electromagnetic shower • Strongly interacting particles: • Hadronic shower, MIP • Calorimeter measures energy, • position, and TOF Fiber Scintillator Pb + generate shower generate light collect light • Charged shower particles generate Cherenkov photons in the PbGl • The Ch. Photons propagate with a wavelength dependent attenuation to the PMT homogeneous lead-glass Cherenkov radiator PMT PbGl
Principle of Measurements • p0 -> 2g • E2 = p2 + minv2 (c=1) • Conservation of energy and momentum • Valid for both p0 and 2g system • E2(2g) – p2(2g) = minv2 (p0) • E(2g) = E(g1) + E(g2) • (2g) = (g1) + (g2) • Take any two photons in event • Calculate minv • If minv = 135 MeV -> p0
Limits of Measurements • Alternative formula: minv2 = 2E1E2(1-cosψ) • Not good to calculate minv • cos needs more CPU than vector addition! • But illustrates • the higher the p0 pT the smaller the opening angle • natural limit of p0 measurement
Limits of Measurements II • High pT • From 10 (15) GeV on • clusters start to merge • Beyond 25 (30) GeV • photons overlap completely • look like single photon • Low pT: • nonlinearity of EMCal response • corresponding uncertainty • p0 spectra so far only starting from 1 GeV • Going to lower pT might be possible but is challenging
Measuring eta • There are less eta mesons compared to p0 • e/p ratio ~ 0.5 • The branching ratio into photons is smaller (40%) • Mass is higher compared to pions: • For given pT, opening angle is bigger • At low pT - harder to hit the detectors • At high pT – easier to measure as merging starts later
Analysis Outline • Photon PID Cuts • Asymmetry cut on pairs of photons • Invariant Mass Distribution • Mixed Event Background Subtraction • Acceptance + Efficiency Corrections
g PID Cuts on Photons • p0 peak is the best Particle Identification criterion one can ask for • Photon PID not mandatory • So why bother with additional PID cuts? • hadrons contribute to background • Getting rid of hadrons • increases signal/background ratio • decreases statistical error of p0 yield • Comparison of different PID’s to estimate systematic uncertainty
g PID: Energy Cut • At low energy calorimeter response is nonlinear • Shower maximum close to detector surface • in case of PbGl • Cherenkov photons have to travel all the way through lead glass • absorption • Nonlinearity not known well enough (simulations) • large uncertainty on energy We can use PID cuts to eliminate detector disadvantages – and optimize !
g PID: Shower Shape • Hadron shower: λint > X0 • Spread of hadronic shower larger • longitudinally • laterally • Lateral shower spread used to reject hadronic showers Example for PID cuts to use detector design !
Asymmetry cut • Asymmetry cut α • Energy asymmetry of photon pair • pairs from p0 decays • Flat asymmetry distribution • random orientation of decay axis relative to p0 momentum • Random pairs • asymmetric energies favored • Reason • steeply falling photon energy spectrum • many low-energy photons available to form random pairs Asymmetry cut increases signal/background !
p0 p0 Reconstruction • Identified by minv of decay-photon pair • Which two photons in event originate from p0 ? • All possible combinations of photon pairs • Background of pairs that randomly have right invariant mass
p0 Mixed Events • Random background estimated by mixed events technique • Pair combinations of photons from different events • By construction, photons cannot originate from same p0 • Random minv distribution • In p+p: Fit of random background good enough
p0 Mixed Events II • minv distribution for real and mixed events • Mixed event distribution has to be normalized to real event distribution • In principle one knows the normalization • In practice much too complicated to know • # pairs real: n(n-1)/2 • # pairs mixed: n*m • n, m vary event by event • Would need to keep track of all n, m • Correlated pairs in peak in real events become uncorrelated pairs in mixed events • Would require iterative procedure to calculate normalization (and peak content) • Other correlations in real events whose size is not known (η, other resonances, back-to-back correlations, non-vertex p0’s, HBT) Normalization simply from real/mix ratio outside peak region, but close to it !
First order polynomial Constant for syst. error p0 Invariant Mass [GeV/c2] Invariant Mass [GeV/c2] Invariant Mass [GeV/c2] Yield Extraction Example : p0 d+Au Real/Mix Real normalized Mix Real - normalized Mix pT =1-1.5 GeV/c
p0 Invariant Mass [GeV/c2] Invariant Mass [GeV/c2] Invariant Mass [GeV/c2] Yield Extraction Example : h p+p Real/Mix Real normalized Mix Real - normalized Mix pT =4-4.5 GeV/c
p0 Invariant Mass [GeV/c2] Invariant Mass [GeV/c2] Invariant Mass [GeV/c2] Yield Extraction Example : h p+p Real/Mix Real normalized Mix S/B: 0.21 – 2.0 Real - normalized Mix pT =4-4.5 GeV/c
p0 h min bias Au+Au Real/Mix Real normalized Mix S/B: 0.002 – 1.5 Real - normalized Mix pT =3-4 GeV/c Invariant Mass [GeV/c2]
Where is the peak? • It’s not at the mass ! • Natural with of p0 peak is 7.7 eV -> negligible • Measured width comes from limited energy resolution of detector • Random up and down fluctuations of energy along with steeply falling spectrum increase the average observed energy in a given bin • This shifts the p0 peak up
Simulation I • A fast Monte Carlo • Generate photons and p0’s randomly according to assumed pT and y distribution • Smear energy and position of photons • Shower overlap: • Decide randomly for each photon whether overlap takes place • model PID cut losses by energy dependent photon survival functions • Tuning • tune smearing and overlap probability by comparing p0 peak position and width from Fast MC to real data • estimate PID cut losses by comparing raw p0spectra for different PID’s • Fast MC: fast, good description if occupancy low • limitations in central Au+Au !
Simulation II • A full simulation • detector response of single photons or p0’s simulated with GEANT • single particle response embedded into measured events before reconstruction • Assumption: no significant change of event properties • reconstruct event • compare pT of embedded particle after reconstruction to input pT • Tuning • Adjust energy and position resolution to match p0 peak position and width in real data Full simulation difficult to maintain Learn from full simulation, use fast implementation as soon as possible !