Download
1 / 30
310 likes | 352 Views
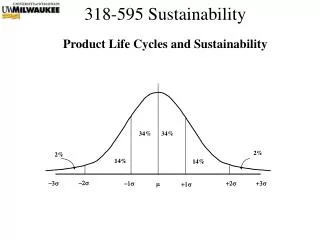
Product Life Cycles and Sustainability. 34%. 34%. 2%. 2%. 14%. 14%. -2s. -3s. +2s. +3s. -1s. m. +1s. Product Life Cycles. Concept Design Manufacture Shipment and Installation Warranty Period Useful Life Failure and Repair Disposal. Product Life Cycles. Concept Design

E N D
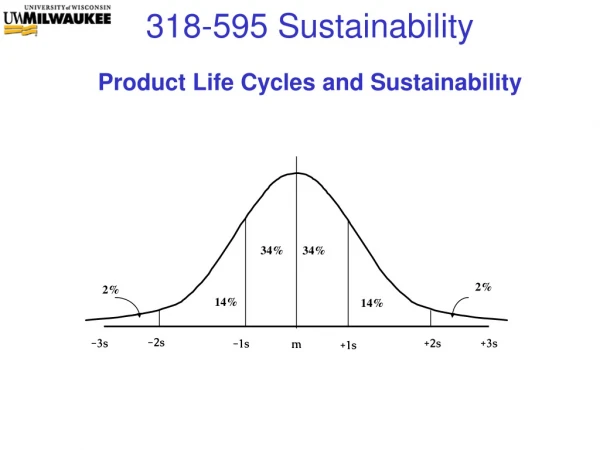
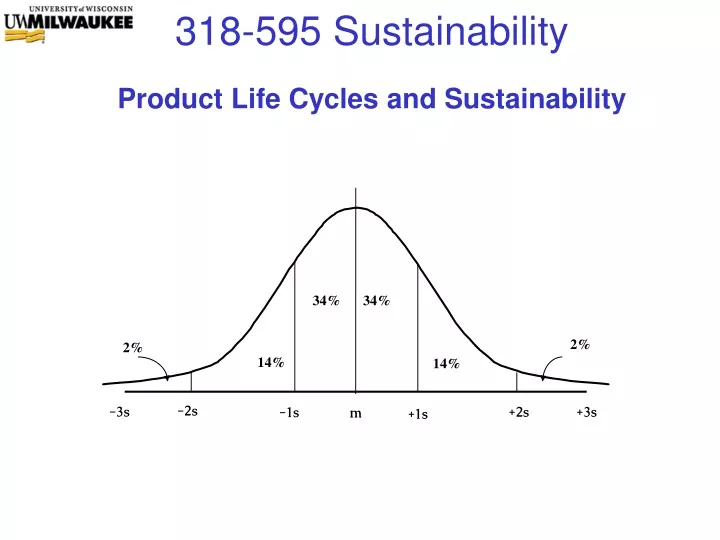
Product Life Cycles and Sustainability 34% 34% 2% 2% 14% 14% -2s -3s +2s +3s -1s m +1s
Product Life Cycles • Concept • Design • Manufacture • Shipment and Installation • Warranty Period • Useful Life • Failure and Repair • Disposal
Product Life Cycles • Concept • Design • Manufacture • Shipment and Installation • Warranty Period • Useful Life • Failure, Service & Repair • Disposal Traditional Design Eng Focus Traditional Mfg Eng Focus
Product Life Cycles • Concept • Design • Manufacture • Shipment and Installation • Warranty Period • Useful Life • Failure, Service & Repair • Disposal Traditional Design Eng Focus Traditional Mfg Eng Focus Life Cycle Product Focus
Customer Labeling: User Manual • Product Specifications • List Product Level Capabilities/Functions • Performance Requirements • Standard Requirements • Must Include Environmental incl Temperature, Humidity, etc • Must Include Mechanical Dimensions, Mass, Shock, etc • Control Inputs • Outputs including Displays • Interfaces including precise definition of connectors, signals • Complete Description of Operating Modes • Button or Menu Sequences for Clarity
User Manual • Safety and Regulatory Certifications • UL Safety Standards • IEC and CISPR EMC Standards • User Warnings • Limitations of Product by Demographics, Geographics • Cautions and Warnings • Compatibilities or Incompatibilities • Specific Label Applications or Misapplications • Safety Rules
User Manual • Installation • How do I install the product? • Operation …..How do you use the product? • Step Method (used for simple products) • Step 1, Step 2, …. etc • Menu Method • Show how to move to any given mode • When in mode, show all user screens or displays • Show/Describe all Possible User Inputs • Describe all Possible Outputs/Displays user may see
User Manual • Maintenance • Specified for a period of calander time, operational time or number cyclic operations • Describes what is to be calibrated, checked, replaced, etc • Test Procedures, Calibration Procedures, Replacement Procedures • Typical Replacements Include • Batteries • Sensors • Filters • Mechanical Wearout Components such as drive belts, pulleys, etc • Manual Section should show picture and textual replacement steps • Manual should indicate who should perform the maintenance (authorization, training level, etc) • Relationship to product warranty
User Manual • Service • Specified for repairs above and beyond normal maintenance • Service Strategies Include (Select 1 or more) • Field Repair by User • Requires service manual and replacement part depictions • Requires a concise list of replacement parts and procurement • Specialized Service Center • Requires specific replacement parts list • Specific testing equipment and skills • Factory Repair or Replacement • Still Requires replacement parts list documentation • Requires repair process chart (mimics mfg test processes) • Assembly/Dissassembly • Default-Disposal • Requires disposal strategy, No repair strategy • Must identify specific disposal procedures for ALL batteries
User Manual • Warranty (From Previous Lab) • Specified for a period of time or number of operations • Must specify how to exercise the warranty • Teams should show (in ppt slide) relationship between warranty period and reliability calculations • Reliability analysis yields F(1 warranty period) = % of population that will fail within 1 warranty period. Assign Cost/Failure. • Warranty Costs = $ Cost of Failures << 1% of total sales • MTBF under simplified conditions indicates when ~63% of population has failed. In general, Warranty Period << MTBF
User Manual • Other Sections/Elements • Digital Pictures • Ideal for Describing User Controls • Assembly/Dissassembly, Exploded Views • Correct operational waveforms • Common Troubleshooting • Problem/Symptom • Cause • Corrective Action
Sustainability Aspects: Obsolescence • Standardized Industry Life Cycle Definition • Standardized Statistical Prediction Tool • Component Life Parameters, u, s • For any given part you must consider; • Part Type and Functionality • Manufacturer(s) and number of sources • Part Technology and Process • Part Package
Sustainability 6 Std Component Production Life Phases Rate of Production • = Mean (Max) Sales of Unit Components per Unit Time s = One Standard Deviation in Production/Time or Sales/Time
Production Life Cycle of a Component • Special Histogram of Production as Measure by Component Sales/Time (# shipped/time) • Concept Assumes Component Sales follow monotonically increasing to peak, then monotonically decreasing to obsolescence • Life Cycle is Measured Relative to Peak of Sales • +/- 1s from Peak = Mature Product • -1s to –2s from Peak = Growth Product • -2s to –3s from Peak = Introductory Product • +1s to +2s from Peak = Declining Product • +2s to +3s from Peak = Phase Out Product • +3s and higher from Peak = Obsolete Product
Statistics Application: Production Life Cycle of a Component Recall Area under curve = Percent Probability 34% 34% 2% 2% 14% 14% -2s -3s +2s +3s -1s m +1s Characterized by Two Parameters m and s2 Normal Distribution = N( m,s2 )
Sustainability Life Cycles of IC Process Voltages 2000 2010 2020 1980 1990
Sustainability Discrete RC, SMT Package Outlook Decreasing Power Rating Dominant Package by Year
Sustainability Aspects: Obsolescence • For each applicable component in your block BOM, perform a variance analysis • 1st Consider the part type: Find the u+(2.5)s, u+(3.5)s dates • 2nd Consider any applicable attributes • 3rd For each attribute find the u+(2.5)s, u+(3.5)s dates • Find the worst case u+(2.5)s, u+(3.5)s dates • Use u, s in years • +2s to +3s from Peak = Phase Out Product • +3s and higher from Peak = Obsolete Product • Create a separate BOM table of obsolescence analysis with above data • ID all parts above the 2.5s, Separately ID all above 3.5s Formulate Corrective Actions or Risk Mitigations Note: If you have a component that does not fit any category, ignore it for this analysis
Requirements – Brief Review User Level Product Level Block Levels Definition: “Statements of desired product performances and features used to define and quantify a product design” • User Level: Special list or labels which state the intended application and/or purpose of the product (Labeling) • Product Level: Quantitatively state all features, performances, and interfaces described in “Eng Terms” • Block Level: State all features, performances and interfaces describing the block in “Engineering Terms” • User Level >>> Validation (User Testing) • Product & Block Level>>>Verification (Eng Testing) Effective Engineering means full verification of requirements !!
Recall Requirement Allocation and Association to Design Blocks • ALLProduct Level Requirements Must be allocated or associated to each Design Block within the project to complete a System Design Phase • Allocated: % of total budgeted to applicable design blocks plus margin. For example: Product Cost, Power Consumption, Mass …. • Associated: Used when allocation is not applicable. For example: Country(s) of Market, Annual Volume, Safety Standards ….
How Do I Show Requirement Verification ? • Inspection, Existence (Mostly Std Requirements) • User Manual (UM) • Product Labeling • Business Case • BOM’s, Asm Dwgs and other Eng Dwgs • Engineering Analysis (Mix of Std and Perf Requirements) • Analog Worst Case DFM Analysis • Digital Worst Case DFM Analysis • Circuit Simulations, Other Numerical Analysis • Lab Testing (Mix of Std and Perf Requirements) • Bench testing circuit performances using metrology • Mechanical Measurements • Integration with other design blocks, compatible equipment • HALT and Other Stress Tests for Reliability • Safety and EMC Testing
Objective Verification Evidence • Verification Plan • Numbered List or Numbered Table of ALL requirements • Corresponding List or Table of Verification Types • Location or Pointer to Verification Evidence File(s) or Doc(s) • Detailed Test Plan and Test Results Document • Use for All Simulation and Lab Test Verifications • Written with sufficient detail, a 2nd party could perform the testing • Must describe all inputs, permutations, configurations, and expected output limits • Test Results may be in a separate document in case multiple verifications will be conducted. Sims, Scope Traces, Digital Photos • Summary of Verification (Lab 10) • List Key Requirements and Verification Types Employed • List Any Requirements which were Unverifiable • Summarize Detailed Test Plan for Key Performance Requirements • Show % of Requirements Verified (Coverage)
Sustainability Aspects: Appendix Component Life Cycle Data Table • DOI = Date of First Introduction to Market • Note: Based on actual data but ALL numbers may not be realistic
Sustainability Aspects: Appendix Component Life Cycle Attribute Data Table
Sustainability Aspects: Appendix Actual Study Data Example • Assume Microcontroller is Special Consumer • For Digital and other IC’s don’t use Type attributes Add 5 years to correct
Obsolescence Table Example • Sample calculations for a few suspect IC’s (Present Date p = 2000.8) • In this case, the present date was subtracted from the window points and any negative value means there is a potential issue