Download
1 / 34
340 likes | 483 Views
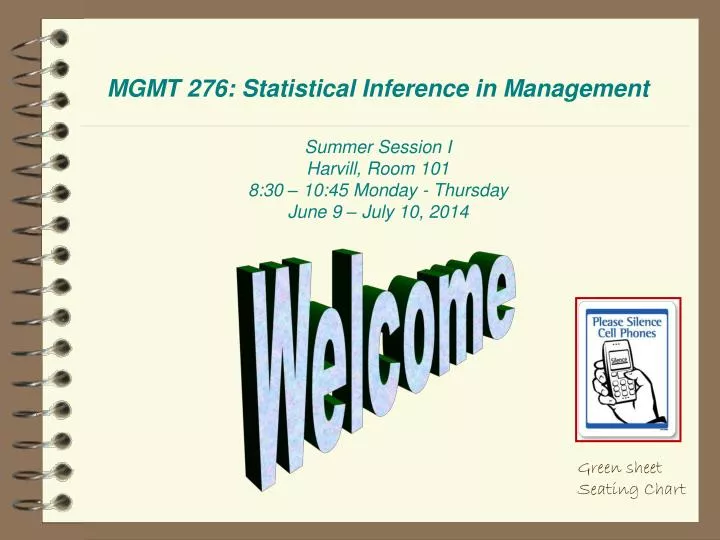
MGMT 276: Statistical Inference in Management Summer Session I Harvill, Room 101 8:30 – 10:45 Monday - Thursday June 9 – July 10, 2014. Welcome. Green sheet Seating Chart. Please start portfolios. Schedule of readings. Before next exam:

E N D
MGMT 276: Statistical Inference in ManagementSummer Session IHarvill, Room 1018:30 – 10:45 Monday - ThursdayJune 9 – July 10, 2014 Welcome Green sheet Seating Chart
Please start portfolios
Schedule of readings • Before next exam: • Please read:• Supplemental reading (Appendix D) • • Supplemental reading (Appendix E) • • Supplemental reading (Appendix F) • 1 - 4 in Lind • Please read Chapters 1, 5, 6 and 13 in Plous • Chapter 1: Selective Perception • Chapter 5: Plasticity • Chapter 6: Effects of Question Wording and Framing • Chapter 13: Anchoring and Adjustment
Please click in My last name starts with a letter somewhere between A. A – D B. E – L C. M – R D. S – Z
Use this as your study guide By the end of lecture today6/18/14 • Measures of variability • Range, Standard deviation and Variance • Memorizing the four definitional formulae • Objectives of research in business • Counting ‘standard deviations’ – z scores • Connecting raw scores, z scores and probabilityConnecting probability, proportion and area of curve • Percentiles • Exam 1
Mean = 100 Standard deviation = 5 If we go up one standard deviation z score = +1.0 and raw score = 105 If we go down one standard deviation z score = -1.0 and raw score = 95 85 90 95 100 105 110 115 If we go up two standard deviations z score = +2.0 and raw score = 110 If we go down two standard deviations z score = -2.0 and raw score = 90 85 90 95 100 105 110 115 If we go up three standard deviations z score = +3.0 and raw score = 115 If we go down three standard deviations z score = -3.0 and raw score = 85 85 90 95 100 105 110 115 z score: A score that indicates how many standard deviations an observation is above or below the mean of the distribution z score = raw score - mean standard deviation
Raw scores, z scores & probabilities • Notice: • 3 types of numbers • raw scores • z scores • probabilities Mean = 50 Standard deviation = 10 z = -2 z = +2 If we go up two standard deviations z score = +2.0 and raw score = 70 If we go down two standard deviations z score = -2.0 and raw score = 30
Normal distribution Raw scores z-scores probabilities Z Scores Have z Find raw score Have z Find area z table Formula Have area Find z Area & Probability Raw Scores Have raw score Find z
. Find score associated with the 75th percentile 75th percentile Go to table nearest z = .67 .2500 x = mean + z σ = 30 + (.67)(2) = 31.34 .7500 .25 .5000 24 36 ? 28 34 26 30 31.34 z = .67
. Find the score associated with the 25th percentile 25th percentile Go to table nearest z = -.67 .2500 x = mean + z σ = 30 + (-.67)(2) = 28.66 .2500 .25 .25 28.66 24 ? 36 28 34 26 30 z = -.67
Variability and means Variability and means 38 40 44 48 52 56 58 The variability is different…. The mean is the same … What might the standard deviation be? 38 40 44 48 52 56 58 Remember to keep number lines same for both examples
Variability and means Grades of all students in the class • 65 70 75 80 85 90 • Grades Grades of “C” students What might the standard deviation be? What might this be an example of? • 65 70 75 80 85 90 • Grades Other examples?
Variability and means Remember, there is an implied axis measuring frequency f 60 65 70 75 80 85 90 f Remember to keep number lines equally spaced 60 65 70 75 80 85 90 Remember to keep number lines same for both examples Variable must be numeric
Variability and means Birth weight for infants From entire population 1 3 5 7 9 11 13 Birth weight in pounds Birth weight for infants from a “typical family” What might the standard deviation be? What might this be an example of? • 3 5 7 9 11 13 • Birth weight in pounds Other examples? Notice: number lines equally spaced
Variability and means Social distance norm(personal space) for international community 40 50 60 70 80 90 100Social Distance Norm Social distance norm (personal space) for Tucson What might the standard deviation be? What might this be an example of? 40 50 60 70 80 90 100 Social Distance Norm Other examples? Notice: number lines equally spaced
Variability and means Distributions same mean different variability Final exam scores “C” students versus whole class Birth weight within a typical family versus within the whole community Running speed 30 year olds vs. 20 – 40 year olds Number of violent crimes Milwaukee vs. whole Midwest Social distance (personal space) California vs international community
Variability and means Distributions different mean same variability Performance on a final exam Before versus after taking the class 40 50 60 70 80 90 100 Score on final (before taking class) 40 50 60 70 80 90 100 Score on final (before taking class) Notice: number lines equally spaced
Variability and means Distributions different mean same variability Height of men versus women 62 64 66 68 70 72 74 76Inches in height (women) 62 64 66 68 70 72 74 76Inches in height (men) Notice: number lines equally spaced
Variability and means Distributions different mean same variability Driving ability Talking on a cell phone or not 2 4 6 8 10 12 14 16Number of errors (not on phone) 2 4 6 8 10 12 14 16Number of errors (on phone) Notice: number lines equally spaced
Variability and means Comparing distributions different mean same variability Performance on a final exam Before versus after taking the class Height of men versus women Driving ability Talking on a cell phone or not Notice: number lines equally spaced
. Writing Assignment Comparing distributions (mean and variability) • Think of examples for these three situations • same mean but different variability • same variability but different means • same mean and same variability (different groups) • estimate standard deviation • calculate variance • for each curve find the raw score for the z’s given Remember: number lines equally spaced
. Writing AssignmentComparing distributions (mean and variability) • Think of examples for these three situations • same mean but different variability • same variability but different means • same mean and same variability (different groups) • estimate standard deviation • calculate variance • for each curve find the raw score for the z’s given Hand in worksheet
What is probability 1. Empirical probability: relative frequency approach Number of observed outcomes Number of observations Probability of getting into an educational program Number of people they let in 400 66% chance of getting admitted Number of applicants 600 Probability of getting a rotten apple 5% chance of getting a rotten apple Number of rotten apples 5 Number of apples 100
What is probability 1. Empirical probability: relative frequency approach “There is a 20% chance that a new stock offered in an initial public offering (IPO) will reach or exceed its target price on the first day.” “More than 30% of the results from major search engines for the keyword phrase “ring tone” are fake pages created by spammers.” 10% of people who buy a house with no pool build one. What is the likelihood that Bob will? Number of observed outcomes Number of observations Probability of hitting the corvette Number of carts that hit corvette Number of carts rolled 182 = .91 200 91% chance of hitting a corvette
2. Classic probability: a priori probabilities based on logic rather than on data or experience. All options are equally likely (deductive rather than inductive). Likelihood get question right on multiple choice test Chosen at random to be team captain Lottery Number of outcomes of specific event Number of all possible events In throwing a die what is the probability of getting a “2” Number of sides with a 2 1 16% chance of getting a two = Number of sides 6 In tossing a coin what is probability of getting a tail 1 Number of sides with a 1 50% chance of getting a tail = 2 Number of sides
3. Subjective probability: based on someone’s personal judgment (often an expert), and often used when empirical and classic approaches are not available. 60% chance that Patriots will play at Super Bowl Likelihood that company will invent new type of battery Likelihood get a ”B” in the class There is a 5% chance that Verizon will merge with Sprint Bob says he is 90% sure he could swim across the river
Approach Example Empirical There is a 2 percent chance of twins in a randomly-chosen birth Classical There is a 50 % probability of heads on a coin flip. Subjective There is a 5% chance that Verizon will merge with Sprint
Little break Exam 1
Class I.D. Number Your 4-digit number (that you use for homeworks etc) 7 6 4 2 1 3 3 2 0 5 8 2 8 1 0 3 5 4 Test I.D. Number Unique 6-digit number (on test booklet) University Student I.D. Number (exactly 8 digits) De l a n e y S u z a n n e Your nameLast name comes first
Exam Put everything away (Your backpack should be completely under your chair) Just an ID card, pencils, and a calculator If you need to use the restroom please go before the test starts
Exam • Once you finish your exam you are free to go 2) If you need to use the restroom please go before the test starts 3)You may be asked to show identification 4)Your backpack should be completely under your chair – nothing by your feet - hats backwards 5) Please keep scantron covered 6) Tests will be handed out Find your test on the top and pass them over If someone is not here put their test on bottom of pile 7) We will do what we can to support your choice not to cheat, please support your neighbors and please do not be tempted Ask questions if you want and Good Luck!
Class I.D. Number Your 4-digit number (that you use for homeworks etc) 7 6 4 2 1 3 3 2 0 5 8 2 8 1 0 3 5 4 Test I.D. Number Unique 6-digit number (on test booklet) University Student I.D. Number (exactly 8 digits) De l a n e y S u z a n n e Your nameLast name comes first
Thank you! See you next time!!