Download
1 / 27
270 likes | 413 Views
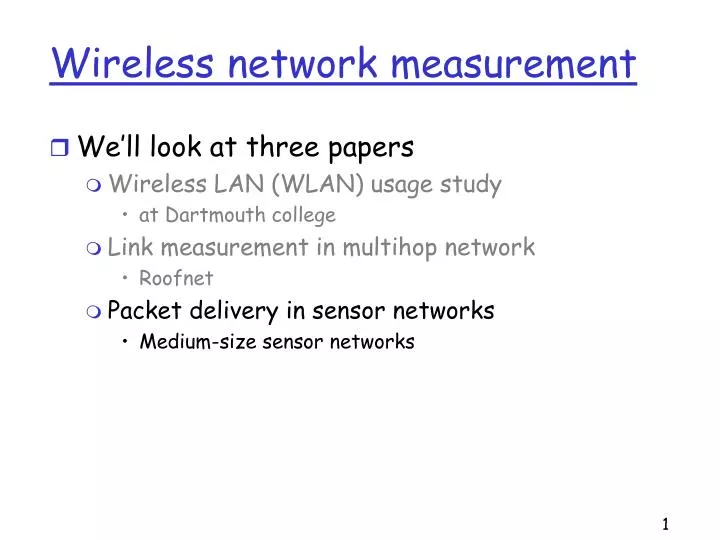
Wireless network measurement. We’ll look at three papers Wireless LAN (WLAN) usage study at Dartmouth college Link measurement in multihop network Roofnet Packet delivery in sensor networks Medium-size sensor networks.

E N D
Wireless network measurement • We’ll look at three papers • Wireless LAN (WLAN) usage study • at Dartmouth college • Link measurement in multihop network • Roofnet • Packet delivery in sensor networks • Medium-size sensor networks
Understanding Packet Delivery Performance in Dense Wireless Sensor Networks Jerry Zhao & Ramesh Govindan SenSys ‘03
Motivation • wireless sensor networks • deployed in harsh environment • using low power radio (not much frequency diversity) • densely deployed • quantitative understanding of packet delivery • physical-layer measurement (w/o interfering transmission) • Dependence on environment, physical-layer coding scheme, and receiver? • MAC layer measurement (w/ interfering transmission) • Effect of carrier sense, MAC layer retransmission?
Why focus on packet delivery? • Very basic • Packet delivery ratio determines energy efficiency & network lifetime • Poor packet delivery may degrade application performance • Important for evaluating almost all communication protocols
Experiment design • Experiment environment • Indoor environment (office building) • Natural habitat • Empty parking lot • Sensor nodes • Mica motes • Experiment software
Experiment environment • I: office building • 2m x 40m hallway • harsh environment: multipath reflection • H: habitat • 150m x 150m segment of a state park • downhill slope • multi-path due to foliage & rocks • O: open parking lot • 150m x 150m open parking lot • “benign” environment
Sensor nodes: Mica motes • 4MHz Atmel processor, 512KB flash memory • ASK (amplitude shift keying) • low-power 433Mhz radio • omni-directional antenna • nominal throughput of 20Kbps • TinyOS • physical-layer error detection/correction • MAC: CSMA/CA, link-layer ACK
Experiment software • Traffic generator • Periodic generation • Generation following a distribution • Upload experiment parameters • Information logger (in TinyOS)
Packet delivery at physical layer • topology: 60 motes placed in a line • single transmitter: head of line • 0.5m apart • 0.25m apart near the edge of the comm. range • remove some nodes near the transmitter • traffic: periodic transmission, 1 pkt/sec • disable TinyOS MAC & retransmission • physical-layer coding • three coding schemes • transmit power • high, medium, low
Physical layer encoding scheme • SECDED (Single Error Correction & Double Error Detection) • TinyOS default • convert each byte into 24 bits • can detect 2 bit errors & correct one bit error • Manchester encoding • convert a byte into 16 bits • detect an error out of 2 bits • 4-bit/6-bit scheme (4b6b) • encode one byte into 12 bits • detect 1 bit error out of 6 bits
I H O Packet loss in three environments 4b6b coding, high Tx power
H M L Packet loss with different transmit power • better delivery under lower power (possibly due to reduced multi-path problems) 4b6b coding, indoor environment
Packet delivery using different coding schemes • SECDED is much better (however also consumes more bandwidth) • 4b6b & Manchester coding similar performance high tx power, indoor environment
I H O How does reception rate vary with distance from the transmitter? • Gray area due to multipath problems • Width of gray area significant high tx power, 4b6b coding
Are the results representative? • losses caused by multipath • difficult to be overcome by low-power radio • Low frequency diversity
Implications • likelihood of links falling into gray area is high • shortest path (in hop count or geographic distance) may not be good • a long hop may have high loss rate • other bad consequences • nodes need to carefully select neighbors based on measured packet delivery rate
Can signal strength predict link quality? • Unfortunately, NO Indoor, high Tx Power
Can sophisticated physical layer coding mask the gray area? • Not necessarily, SECDED has the lowest effective bandwidth Theoretical calculation
I O H Packet delivery correlation • I & O show noticeably higher correlation than H • Implication: at the physical layer, independent losses are a reasonable assumption
Temporal characteristics of packet delivery stdev of average delivery ratios • Large variations in average reception rate • time varying packet losses in gray area in 40sec windows
Packet delivery at MAC Layer • TinyOS MAC • CSMA/CA: random backoff upon carrier sense • no RTS/CTS • link layer ACK: send 4 byte ACK to the sender • retransmit up to 3 times, when there’s no ACK • Experiment methodology • fix physical-layer coding (4b6b) • three environments • topology • traffic pattern
Topology • multihop network • medium transmit power • indoor office building • 62 motes, one every office • node degrees: 15-18 • open parking lot • similar topology • node degrees: 17-20 • natural habitat • 4 x 12 grid, 0.75 m between two nodes • node degrees: 6-8
Traffic pattern • each node sends k packets per second • k=0.5, 1, 2, 4 pkts/sec • inter-packet interval • exponentially distributed • avoid packet synchronization • each node unicasts packets (36 bytes) to neighbors in round-robin fashion • neighbor table: periodic broadcast • not intended to model application traffic
H O I Packet loss distribution w/ retransmission • many packet losses • packet losses due to environment noise or collision? • better MAC (e.g., S-MAC) is required 30% of links have loss rate > 0.5
Packet delivery efficiency # of distinct pkts received / # of pkts transmitted • Efficiency low - better MAC is required
indoor Asymmetry in packet delivery absolute difference of packet loss rates in two directions of a link • Significant asymmetry, should try to avoid such links
Conclusions • understand packet delivery in dense sensor networks • measurement at physical & MAC layers • quantify the prevalence of gray area • pathological links: large variance in loss rate; unpredictable loss rate; asymmetric • implications • “topology control”: select links based on measurement, avoid links in gray area • better MAC