Download
1 / 58
580 likes | 672 Views
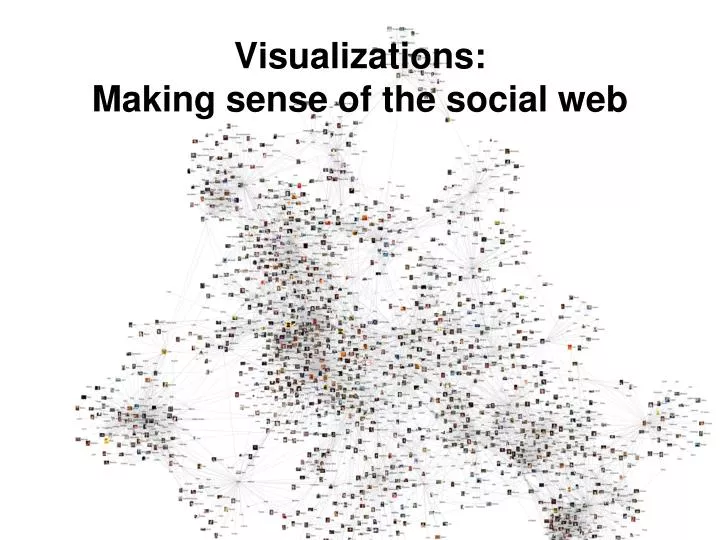
Visualizations: Making sense of the social web. Chat Circles. Usenet (Smith et al.). Usenet 2000. Usenet (Smith et al.). Usenet 2004. Taking a Step Back. Before talking about next section, useful to take a step back and think about good and bad visualizations.

E N D
Usenet (Smith et al.) • Usenet 2000
Usenet (Smith et al.) • Usenet 2004
Taking a Step Back • Before talking about next section, useful to take a step back and think about good and bad visualizations
Variables You Can Manipulate Size Value Orientation Texture Shape Position (2D / 3D)
Appropriate Use of Color • Don’t use ROYGBIV for colors • Modify the saturation and/or intensity instead
Design Guidance Tufte • Tell the truth (baseline, scale, context) Lie Factor = size of effect shown/ size of effect in data
Design Guidance Tufte 2. Be careful with size coding (height/width v. area vs volume)
Smooth Transitions • Baby Name Wizard (http://www.babynamewizard.com/voyager#)
Shneiderman’s Mantra Overview First, Zoom and Filter, Details on Demand Overview First, Zoom and Filter, Details on Demand Overview First, Zoom and Filter, Details on Demand Overview First, Zoom and Filter, Details on Demand Overview First, Zoom and Filter, Details on Demand Overview First, Zoom and Filter, Details on Demand Overview First, Zoom and Filter, Details on Demand Overview First, Zoom and Filter, Details on Demand Overview First, Zoom and Filter, Details on Demand Overview First, Zoom and Filter, Details on Demand
InfoViz’s Can Show and Hide Info • US Election 2004 2004
microsoft.public.windows.server.general • Who are these people? Days Active in Newsgroup Posts per Thread in Newsgroup
AuthorLine: Answer person Initiated by Author Initiated by Someone Else
Initiated by Author Initiated by Someone Else
AuthorLine: Flame warrior Initiated by Author Initiated by Someone Else
Code Swarm (Ogawa) http://www.vimeo.com/1093745
Visualizing Wikipedia • What kinds of things might you want to visualize in Wikipedia? • Contributions by editors • Topics by location / geography • Number of articles in different languages • How many edits are successful / newbies • How often users join • How articles are linked together / author • How many views / used / edits • See how a page changes after /during an event
In-Class Exercise • Break up into groups of ~3 people • Come up with ideas for how to visualize: • Trustworthiness of a page or author • Evolution (and/or conflict) of a page over time • Some other interesting phenomena on Wikipedia • Spend ~8 minutes on this • Will have some teams present their design
Visualizing the “power struggle” in WP http://abeautifulwww.com/2007/05/20/visualizing-the-power-struggle-in-wikipedia/
Assigning trust (Adler, Alfaro, et al.) • Authors are assigned a trust ranking • Text is assigned a trust ranking based on reputation of author and revisers • Darker color means less trust in the text
Conflict at the user level • How can we identify conflict between users? • Here, edges represent reverts Kittur et al., 2007; Suh et al. 2007; Brandes & Lerner, 2008
Terry Schiavo Anonymous (vandals/spammers) Sympathetic to husband Mediators Sympathetic to parents
Group D Group A Group C Group B Dokdo/Takeshima opinion groups
SocialAction (Perer & Shneiderman) http://www.cs.umd.edu/hcil/socialaction/
NodeXL http://nodexl.codeplex.com/
ManyEyes (Viegas, et al.) • Conversations around visualizations (instead of visualizing conversations)