Download
1 / 5
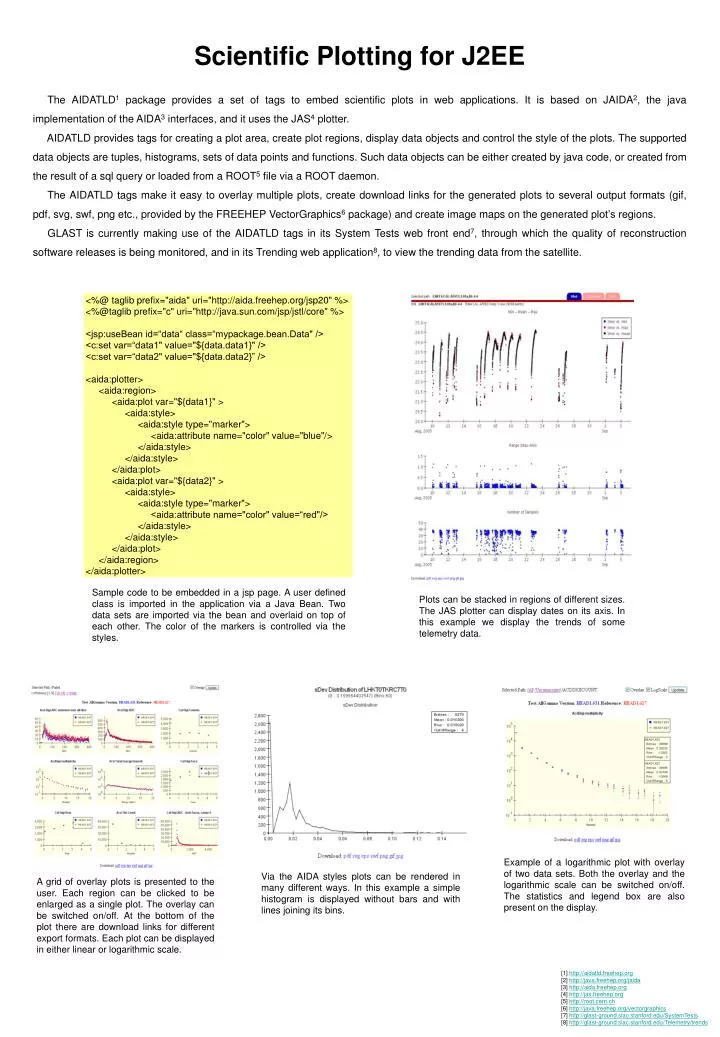
50 likes | 196 Views
<%@ taglib prefix="aida" uri="http://aida.freehep.org/jsp20" %> <%@taglib prefix="c" uri="http://java.sun.com/jsp/jstl/core" %> <jsp:useBean id=“data“ class=“mypackage.bean.Data" /> <c:set var=“data1" value="${data.data1}" /> <c:set var=“data2" value="${data.data2}” /> <aida:plotter>

E N D
<%@ taglib prefix="aida" uri="http://aida.freehep.org/jsp20" %> <%@taglib prefix="c" uri="http://java.sun.com/jsp/jstl/core" %> <jsp:useBean id=“data“ class=“mypackage.bean.Data" /> <c:set var=“data1" value="${data.data1}" /> <c:set var=“data2" value="${data.data2}” /> <aida:plotter> <aida:region> <aida:plot var="${data1}" > <aida:style> <aida:style type="marker"> <aida:attribute name="color" value="blue"/> </aida:style> </aida:style> </aida:plot> <aida:plot var="${data2}" > <aida:style> <aida:style type="marker"> <aida:attribute name="color" value=“red"/> </aida:style> </aida:style> </aida:plot> </aida:region> </aida:plotter> Sample code to be embedded in a jsp page. A user defined class is imported in the application via a Java Bean. Two data sets are imported via the bean and overlaid on top of each other. The color of the markers is controlled via the styles. Plots can be stacked in regions of different sizes. The JAS plotter can display dates on its axis. In this example we display the trends of some telemetry data. Example of a logarithmic plot with overlay of two data sets. Both the overlay and the logarithmic scale can be switched on/off. The statistics and legend box are also present on the display. Via the AIDA styles plots can be rendered in many different ways. In this example a simple histogram is displayed without bars and with lines joining its bins. A grid of overlay plots is presented to the user. Each region can be clicked to be enlarged as a single plot. The overlay can be switched on/off. At the bottom of the plot there are download links for different export formats. Each plot can be displayed in either linear or logarithmic scale. Scientific Plotting for J2EE The AIDATLD1 package provides a set of tags to embed scientific plots in web applications. It is based on JAIDA2, the java implementation of the AIDA3 interfaces, and it uses the JAS4 plotter. AIDATLD provides tags for creating a plot area, create plot regions, display data objects and control the style of the plots. The supported data objects are tuples, histograms, sets of data points and functions. Such data objects can be either created by java code, or created from the result of a sql query or loaded from a ROOT5 file via a ROOT daemon. The AIDATLD tags make it easy to overlay multiple plots, create download links for the generated plots to several output formats (gif, pdf, svg, swf, png etc., provided by the FREEHEP VectorGraphics6 package) and create image maps on the generated plot’s regions. GLAST is currently making use of the AIDATLD tags in its System Tests web front end7, through which the quality of reconstruction software releases is being monitored, and in its Trending web application8, to view the trending data from the satellite. [1] http://aidatld.freehep.org [2] http://java.freehep.org/jaida [3] http://aida.freehep.org [4] http://jas.freehep.org [5] http://root.cern.ch [6] http://java.freehep.org/vectorgraphics [7] http://glast-ground.slac.stanford.edu/SystemTests [8] http://glast-ground.slac.stanford.edu/Telemetry/trends