Download
1 / 22
220 likes | 366 Views
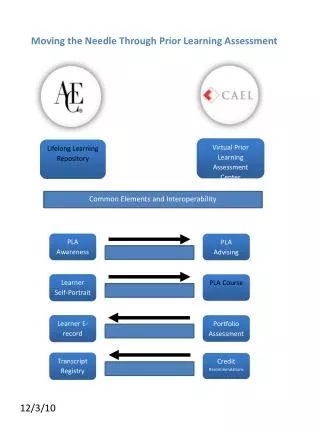
Moving the Needle on Access and Success. Presentation to 2006 SHEEO/NCES Network Conference and IPEDS Workshop May 9, 2006 Washington, DC.

E N D
Moving the Needle on Access and Success Presentation to 2006 SHEEO/NCES Network Conference and IPEDS Workshop May 9, 2006 Washington, DC Cheryl D. BlancoSenior Program Director, Policy Analysis & ResearchBrian T. PrescottResearch AssociateWestern Interstate Commission for Higher Education (WICHE)
Accelerated Learning Options • Definition: Activities that provide high school students with a more rigorous, college-level curriculum and possibly the opportunity to earn college credit while still in high school. • Why Policymakers, Students & Families Want Them: • Provide a more rigorous curriculum. • Enhance students’ chances of succeeding in college. • Give some a competitive edge in admissions process. • Allow students to “test the water” with college. • Decrease time to degree. • Lower cost of degree. • Serve as a recruiting tools for institutions. • Serve as a screening mechanism for institutions.
A National Snapshot of Accelerated Learning Options • Breadth and scope of some Accelerated Learning Options: • Most high schools offer dual credit and/or exam-based courses. • 57% of all Title IV degree-granting institutions had high school students taking courses for college credit in 2002-03. • Estimated enrollments: 1.2 million in dual credit courses, 1.8 million in AP, and 165,000 in IB. • Accessibility of programs varies by type and school size and location: • 82% of large schools offer dual credit courses vs. 63% of small schools. • 97% of large schools offered AP vs. 40% of small schools. • Schools in towns or urban fringe areas were more likely to offer dual credit courses than were schools in cities or rural areas. • Schools in urban fringe areas were far more likely to offer AP than schools in cities, towns, or rural areas. • Schools with the highest minority enrollment are the least likely to offer dual credit courses when compared to schools with lower minority enrollment. • Schools with higher minority enrollment are more likely to offer AP courses than schools with the lowest minority enrollment. Source: NCES, Dual Credit and Exam-Based Courses in U.S. Public High Schools: 2002-03.
Moving the Needle • Purpose: To provide recommendations on how four major accelerated learning programs (Advanced Placement, dual/concurrent enrollment, International Baccalaureate diploma, and Tech-Prep) might be better utilized to increase access and success of low-income and underrepresented students in higher education. • Major activities: • Examined state policies through an extensive inventory of legislation and board rules. • Surveyed public and private, two- and four-year colleges and universities on institutional policies and practices. • Conducted focus group interviews with students at two high schools and two postsecondary institutions. • Prepared a review of the literature. • Conducted a transcript analysis of Florida high school graduates between 1997 and 2003 (734,467 records). • Examined financial data for a few states.
Institutional Survey • Online survey developed at WICHE and sent electronically to 2,232 chief academic officers in public and private, 2- and 4-year institutions in the U.S. • 60% public and 40% private • 225 research universities • 549 master’s • 516 baccalaureates • 921 2-year • 21 tribal colleges • Enrollments ranged from 12 to 58,490; median size of 2,987.
Institutional Survey • Response rate: 25.6% • 65% pubic and 35% private • Research/doctoral: 10% surveyed and 11% responded • masters/baccalaureate: 48% surveyed and 46% responded • Associate’s/tribal colleges: 42% surveyed and 42% responded.
Institutional Survey • Points of analysis for descriptive statistics: • Control (public/private) • Type by Carnegie classification: research/doctoral/ master’s/baccalaureate, and associate’s/tribal • Size: small (2,000 or less), medium (2,001-5,500), large (5,501 or more) • Region: Midwest, Northeast, South, West
Does the institution consider any accelerated learning option for purposes of admission and/or credit requirements?
Does the institution have an outreach program to notify students, particularly low-income, disadvantaged students, about opportunities for accelerated learning options?
Transcript Analysis Overview • Florida’s K-20 Education Data Warehouse • Public high schools and public postsecondary institutions in Florida • High school graduating classes: 1997-2003 • Postsecondary enrollments: 1997-2005 • Data elements (not exhaustive): • Accelerated credits obtained in high school through AP, dual/ concurrent enrollment, IB • High school attended • Courses taken at community colleges, including remedial courses • Postsecondary enrollment: institution(s) and credits attempted and earned by term • Postsecondary degree(s) and date(s) of graduation • Postsecondary credits awarded for accelerated learning, CLEP, life experience, etc. • Demographic info, esp. race/ethnicity • Proxies for low-income: free or reduced price lunch, Pell receipt • Total of 734,467 high school graduates
Participation During High School • In just six years, almost 14,000 more Florida students earned AP credit, an increase of 72 percent. • Increases in dual/concurrent enrollment and IB were also evident and large in relative terms.
Unequal Participation • Low-income students participated in accelerated learning at much lower rates than wealthier students did. • Black and Hispanic students participated at lower rates than White and Asian students did except for Hispanic students, who earned AP credit at approximately the same rate as White students.
AP IB No accelerated credit Dual/concurrent enrollment Enrollment at a State University • All types of students with any type of accelerated credit were more likely to enroll at state universities. • But low-income students enrolled at lower rates than their wealthier peers, regardless of type of ALO. • Black and Hispanic students enrolled at lower rates than Asian/Pacific Islanders and Whites for all ALO types.
AP IB No accelerated credit Dual/concurrent enrollment Enrollment at a Community College • Patterns of college-going were notably different for students attending community colleges. • Dual/concurrent enrollment was associated with the highest rates of enrollment at community colleges. • Only among those with no accelerated credit did low-income students enroll at lower rates. • Although less obvious among students with dual credit, students who earned accelerated credit preferred enrolling at a four-year institution.
AP IB No accelerated credit Dual/concurrent enrollment Remediation (One or More Courses) • Students with accelerated credit were much less likely to enroll in remedial courses. • For each accelerated option, a greater proportion of low-income students took remedial courses than wealthier students, as did students of color compared to White students. • But the proportion of students with accelerated credit who enrolled in remedial courses was still high – ranging from 11% for White students with IB credit and 48% for Hispanic students with AP credit.
AP IB No accelerated credit Dual/concurrent enrollment Bachelor’s Degree Completion • Students with any type of accelerated credit were more likely to complete a bachelor’s degree. • Students with IB credit were most likely to finish. • For each ALO type (and for those with no accelerated credit): • Low-income students were slightly less likely to complete a bachelor’s degree. • Asian and White students were more likely to complete than Black and Hispanic students.
AP IB No accelerated credit Dual/concurrent enrollment Associate’s Degree Completion • Students with any type of accelerated credit were more likely to complete an associate’s degree. • Students with dual credit were most likely to finish. • For each ALO type (and for those with no accelerated credit): • Low-income students were slightly less likely to complete an associate’s degree. • Asian and White students were more likely to complete than Black and Hispanic students.
Elapsed Time to Bachelor’s Degree • Students with accelerated credit were more likely to earn a bachelor’s degree within four years than students without accelerated credit. • Only a small percentage of students were able to complete a bachelor’s degree within 3 years. • Students with AP or IB credit were more likely than those with dual credit to finish within four years. Notes: Elapsed time to degree is the number of years between high school graduation and bachelor’s degree completion. Students still enrolled in Fall 2004 account for the remaining percent.
Elapsed Time to Associate’s Degree • Students with accelerated credit were more likely to earn an associate’s degree within two years than students without accelerated credit. • Students with dual credit were most likely to finish within two or three years. Notes: Elapsed time to degree is the number of years between high school graduation and associate’s degree completion. Students still enrolled in Fall 2004 account for the remaining percent. Students who transferred to a four-year institution are not counted.
Lessons Learned • Linking to the National Student Clearinghouse • Unit record data is complicated and time-consuming • Data management • Identifying variables • Swirling is a major challenge to meaningful results, e.g., what is the appropriate reference group? • Income
Sponsored by Western Interstate Commission for Higher Education and Jobs for the Future Supported by Lumina Foundation for Education and The Bill & Melinda Gates Foundation To register, go to: www.wiche.edu or www.jff.org
Contact us Cheryl D. Blanco Senior Program Director Policy Analysis and Research - WICHE 303.541.0221 ~ cblanco@wiche.edu Brian T. Prescott Research Associate Policy Analysis and Research - WICHE 303.541.0255 ~ bprescott@wiche.edu www.wiche.edu