Download
1 / 45
470 likes | 756 Views
Integrating Principles and Concepts from General Ecology, Stream Biology, Biological Diversity of Stream Invertebrates, and Water Chemistry. Robert Bohanan, UW Center for Biology Education Stanley Dodson, UW Zoology Dolly Ledin, UW Center for Biology Education

E N D
Integrating Principles and Concepts from General Ecology, Stream Biology, Biological Diversity of Stream Invertebrates, and Water Chemistry Robert Bohanan, UW Center for Biology Education Stanley Dodson, UW Zoology Dolly Ledin, UW Center for Biology Education Kris Stepenuck, UW Extension & WI DNR Jongdee To-im, Visiting Scholar from Thailand
Goals & Objectives • Enhance the ability of leaders of stream and river monitoring programs to provide effective education and training of participants in their programs that result in data that are relevant and useful • Help citizens understand the complex nature of aquatic systems and thereby increase their ability to make informed decisions about water • Create resources that are specific to Wisconsin streams & rivers
Definition of Ecology Ecology is the study of how bioticand abioticfactors influence the distributionand relative abundanceof organisms in ecological systems. Limnology is concerned with all the interrelated factors that influence the water environment.
Units of Study or Investigation • Individual organism • Population of a species of an organism in an area • Community or groups of populations of several species in an area • Ecosystems include communities and abiotic factors • Landscapes can be thought of as a geographic region that typically includes several ecosystems • Biosphere or global ecological systems
Introductions • Number of years that you’ve been involved in water research, education, training, and / or monitoring • 0-5 • 6-10 • 11-15 • 16-20 • 20+ • Your favorite order of aquatic insect
Overarching Concept • Ecology is the study of how living (Biotic) and non-living (Abiotic) factors influence Living Systems • Living Systems include: • Individual organisms • Groups of organisms
What types of factor influence biological diversity in rivers and streams? Abiotic factors Biotic factors Biological Diversity
Thought Questions 1) List examples of biotic factors that are influenced by abiotic factors. 2) List examples of abiotic factors that are influenced by biotic factors. 3) How do biotic and abiotic factors influence biological diversity independently? 4) How do biotic and abiotic factors act in concert to influence biological diversity?
Temperature Substrate Chemical Factors Light Current Biological Diversity Producers Competition Invasive Organisms Predation Consumers
Temperature Substrate Chemical Factors Light Current Biological Diversity Producers Competition Invasive Organisms Predation Consumers
Physical Environment Chemical Environment Biological Environment
Stream order determination Use what you’ve learned about how to classify streams by stream order and for each of the streams on the hypothetical stream network determine stream order.
Stream order determination 1 1 2 1 2 1 3 1 3 2 1 3 1 Use what you’ve learned about how to classify streams by stream order and for each of the streams on the hypothetical stream network determine stream order.
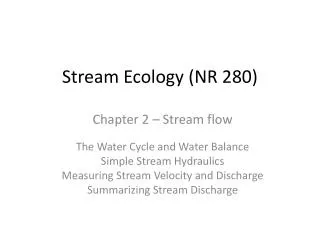
Thought Questions 1) How would water temperature change as you move from streams of a lower order to streams of a higher order in a stream system? 2)How would you expect the types of predators (e.g. species or groups) to change as you move from lower order streams to higher order streams in a stream system? 3)Think about a stream that you’re familiar with its watershed. Determine the stream order. Based on the stream order and using the river continuum concept, determine and describe how the physical and biological characteristics of the stream match what the river continuum concept would predict.
Stream Order Organic Energy Sources Ecological Communities • 1 • 2 • 3 • 4 • 6 • 7 • 8 • 9 • 10 • 11 • 12 Shredders Grazers Predators Collectors Microbes Coarse Particulate Organic Matter Periphyton Collectors Shredders Predators Grazers Microbes Fine Particulate Organic Matter Phytoplankton Zooplankton Collectors Predators Microbes Dissolved Organic Matter Channel Width
Figure 7. Two pathways for organic food in streams. Allochthonous Inputs Autochthonous Inputs Coarse Particulate Organic Matter Leaves Fine Particulate Organic Matter Diatoms Physical Breakdown Photosynthesis Scrapers Shredders Microbes Fine Particulate Organic Matter Predators Collectors Dissolved Organic Matter
Thought Questions 1) How might seasonal changes influence the relative importance of autochthonous production and allochthonous production in a first order stream? 2) Explain how fine particulate organic matter may enter a stream food web from both autochthonous and allochthonous sources?
Basic food web illustration Vertebrate Predators Insect Predators Vertebrate Herbivores Insect Herbivores Organic Matter from outside of the stream Algae & Plants in the stream Microbes
Basic food web illustration Vertebrate Predators Insect Predators Vertebrate Herbivores Insect Herbivores Organic Matter from outside of the stream Algae & Plants in the stream Microbes
Feeding Groups or Guilds • Shredders - Coarse woody or plant associated materials • Filtering Collectors - Suspended particulates, microbes, phytoplankton • Gathering Collectors - Deposited particulates • Grazers/Scrapers - Peryiphyton & fungi • Predators - especially invertebrates
Thought Questions 1) What are some different adaptations that filtering collectors might have for filtering that could reduce competition among the different taxonomic groups that would rely upon suspended organic matter for food? 2) What are some ways that you would further subdivide the predator feeding group of aquatic insects that feed on other aquatic insects?
Importance of Scale in Ecology • Spatial scales can vary widely • Individual Pitcher Plants Function as Aquatic Ecological Systems • Multiple Lakes are Connected Ecologically in a Region Pitcher plan photo by Merel Black
Figure 2. Scale of Sampling and Analysis in Streams Ecosystem/Biome Watershed Ecosystem Reach Community/Ecosystem Pool-Riffle Sequence Hours Days Weeks Months Years Decades Centuries Population/Community Microhabitat Individual Organism, Particle or Grain Millimeters Meters Kilometers Sq. Kilometers
Thought Questions 1) What spatial and temporal scale would you choose to sample to determine changes in populations (number of individuals of the same species in a given area)?
Table 2. Substrate Type Abundance (#/m2) # of Species Sand 920 61 Gravel 1300 82 Pebbles & Cobble 2130 76 Leaves 3480 92 Detritus 5680 66 Graphic presentation of Table 2. x o o o Abundance (# / square meter) (x) x # of species (o) o x o x x Sand Gravel Pebbles & Cobble Leaves Detritus
Thought Questions 1) Explain why the comparison of the relative abundance of aquatic insects could increase in samples starting with sand and then continuing to gravel, and pebbles and cobble. 2) Why might species diversity be lower in samples of detritus compared to intact leaves?
Figure 3. Relationship of Diversity and Abundance (or Density) Number of individuals per stone or density per stone Number of species per stone
Thought Questions 1) What ecological factors might explain the relationship that biological diversity increases as the number of individuals in a sample increases? 2) Under what conditions might you expect to see this relationship reversed?
Figure 4. Relationship of Diversity and Watershed Area Number of species Watershed Area (square miles)
Thought Questions 1) Explain why watershed area or size is related to the biological diversity found within a stream in a watershed. 2) Under what conditions would you expect that biological diversity might be negatively related to watershed area or size?
Figure 5. Relationship of Diversity and Sampling Effort Number of species Number of samples
Thought Questions 1) If changes in sampling effort are related to changes in estimates of biological diversity, how would plan your sampling as part of your monitoring to ensure that your resulting estimates of biological diversity are comparable.
Identifying and Describing Trends in Data • Statistics that describe a pattern in relationships among variables • Correlation coefficients determine the degree to which two variables in a data set covary. • Linear regressions determine a trend in a series of data and can be used to make projections.
Identifying and Describing Trends in Data • Statistics that describe a pattern in relationships among variables • Correlation coefficients determine the degree to which two variables in a data set covary. • Linear regressions determine a trend in a series of data and can be used to make projections.
Trend in HBI Scores in Brewery Creek, Hwy 14 Cross Plains, WI (1985-2002) x x x x x x x x x x x x x Low Water Quality Index High x x 1985 1993 2001
Thought Questions 1) What are some of the most important factors that may influence biological diversity estimates in your monitoring? 2) Considering the data on Brewery Creek, what can you learn from long - term monitoring data that you could not learn from a single monitoring data point?