Download
1 / 9
90 likes | 230 Views
South Asia. Afghanistan. Bangladesh. India. Bhutan. Iran. Maldives. Nepal. Pakistan. Sri Lanka. Southeast Asia. Brunei Darussalam. Cambodia. Viet Nam. Indonesia. Lao PDR. Malaysia. Myanmar. Philippines. Singapore. Thailand. East Asia. China. DPR Korea. Japan. Rep. Of Korea.

E N D
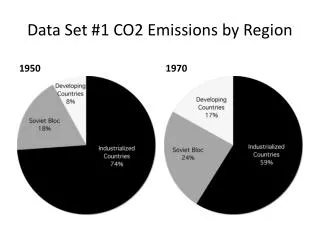
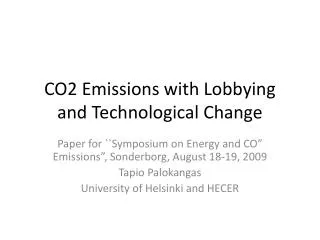
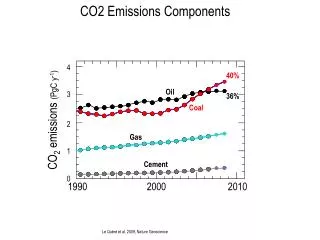
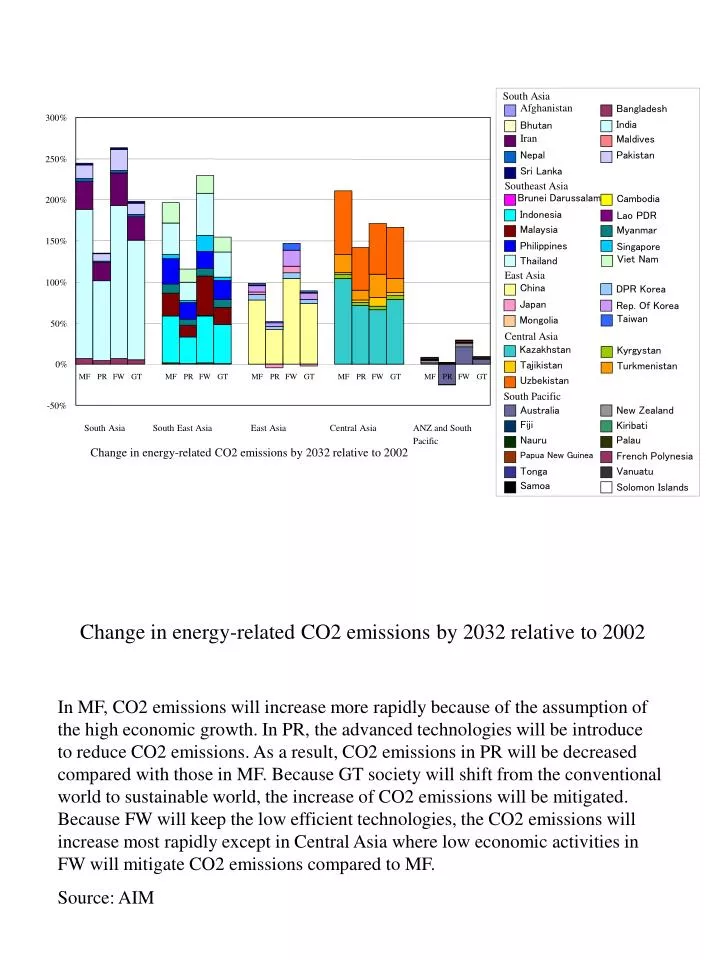
South Asia Afghanistan Bangladesh India Bhutan Iran Maldives Nepal Pakistan Sri Lanka Southeast Asia Brunei Darussalam Cambodia Viet Nam Indonesia Lao PDR Malaysia Myanmar Philippines Singapore Thailand East Asia China DPR Korea Japan Rep. Of Korea Taiwan Mongolia Central Asia Kyrgystan Tajikistan Turkmenistan Uzbekistan South Pacific Australia New Zealand Kazakhstan Fiji Kiribati Nauru Palau Papua New Guinea French Polynesia Tonga Vanuatu Samoa Solomon Islands 300% 250% 200% 150% 100% 50% 0% MF PR FW GT MF PR FW GT MF PR FW GT MF PR FW GT MF PR FW GT -50% South Asia South East Asia East Asia Central Asia ANZ and South Pacific Change in energy-related CO2 emissions by 2032 relative to 2002 Change in energy-related CO2 emissions by 2032 relative to 2002 In MF, CO2 emissions will increase more rapidly because of the assumption of the high economic growth. In PR, the advanced technologies will be introduce to reduce CO2 emissions. As a result, CO2 emissions in PR will be decreased compared with those in MF. Because GT society will shift from the conventional world to sustainable world, the increase of CO2 emissions will be mitigated. Because FW will keep the low efficient technologies, the CO2 emissions will increase most rapidly except in Central Asia where low economic activities in FW will mitigate CO2 emissions compared to MF. Source: AIM
South Asia Afghanistan Bangladesh India Bhutan Iran Maldives Nepal Pakistan Sri Lanka Southeast Asia Brunei Darussalam Cambodia Viet Nam Indonesia Lao PDR Malaysia Myanmar Philippines Singapore Thailand East Asia China DPR Korea Japan Rep. Of Korea Taiwan Mongolia Central Asia Kyrgystan Tajikistan Turkmenistan Uzbekistan South Pacific Australia New Zealand Kazakhstan Fiji Kiribati Nauru Palau Papua New Guinea French Polynesia Tonga Vanuatu Samoa Solomon Islands 300% 250% 200% 150% 100% 50% 0% MF PR FW GT MF PR FW GT MF PR FW GT MF PR FW GT MF PR FW GT -50% -100% South Asia South East Asia East Asia Central Asia ANZ and South Pacific Change in SO2 emissions by 2032 relative to 2002 Change in energy-related SO2 emissions by 2032 relative to 2002 In FW, SO2 emissions will increase most rapidly because little money is invested to reduce SO2 emission under low economic growth world. On the other hand, in the other scenarios, the increase of SO2 emissions will be slow in order to avoid severe air pollution. Especially, in PR and GT the SO2 emissions will be controlled more strictly. Source: AIM
South Asia Afghanistan Bangladesh India Bhutan Iran Maldives Nepal Pakistan Sri Lanka Southeast Asia Cambodia Brunei Darussalam Indonesia Lao PDR Malaysia Myanmar Philippines Singapore Viet Nam Thailand East Asia China DPR Korea Japan Rep. Of Korea Taiwan Mongolia Central Asia Kyrgystan Kazakhstan Turkmenistan Tajikistan Uzbekistan South Pacific Australia New Zealand Fiji Kiribati Nauru Palau South East Central French Polynesia Papua New Guinea Asia Asia Tonga Vanuatu Samoa Solomon Islands Municipal waste generation 120 100 80 Total Asia and Pacific in 1995 = 100 60 40 20 0 1995 1995 1995 1995 1995 1995 GT/2032 FW/2032 MF/2032 PR/2032 GT/2032 FW/2032 GT/2032 FW/2032 GT/2032 FW/2032 GT/2032 FW/2032 MF/2032 MF/2032 MF/2032 MF/2032 PR/2032 GT/2032 FW/2032 PR/2032 PR/2032 PR/2032 MF/2032 PR/2032 South Asia East Asia South Pacific Australia and New Zealand Municipal waste generation in 2032 to 1995 of Asia and the Pacific region Total municipal waste will increase more than 150% by 2032 in South Asia, South East Asia and Central Asia in MF. The municipal waste generation is explained from both income level and population. Although the quantity of waste increases with the increase of income, the growth rate of waste generation is diminishing gradually. The increase of the municipal waste by 2032 to 1990 in East Asia is the lowest among Asian regions. As the current status of GDP and the total amount of waste in Central Asia are low compared to other Asian countries, the growth rate of waste generation in this region is the highest. The growth rate of GT is lower than that of FW except in Central Asia where waste is generated in high speed even in GT, although the total volume is small. Source: AIM
South Asia Afghanistan Bangladesh India Bhutan Iran Maldives Nepal Pakistan Sri Lanka Southeast Asia Cambodia Brunei Darussalam Indonesia Lao PDR Malaysia Myanmar Philippines Singapore Viet Nam Thailand East Asia China DPR Korea Japan Rep. Of Korea Taiwan Mongolia Central Asia Kyrgystan Kazakhstan GT GT GT GT GT FW FW FW FW FW MF MF MF MF MF PR PR PR PR PR Turkmenistan Tajikistan Uzbekistan South Pacific Australia New Zealand Fiji Kiribati Nauru Palau French Polynesia Papua New Guinea Tonga Vanuatu Samoa Solomon Islands 250% 200% 150% 100% 50% 0% South Asia South East Asia Central Asia East Asia ANZ and South Pacific Change in municipal waste generation by 2032 to 1995 The municipal solid waste generation will increase as growth of both population and GDP per capita. Because of the rapid economic growth, the municipal solid waste will be generated most in MF. The increase of waste generation will be mitigated because of the recycling policy in PR, and the more reduction of waste will be realized because of the dematerialized society in GT. In FW, because of the low economic growth, the waste generation per capita will be relatively low, but the rapid population growth will make the waste generation increase. Source: AIM
MF MF MF MF PR PR PR PR FW FW FW FW GT GT GT GT Forest change from 1995 to 2032 60 50 40 30 20 % to 1995 10 0 -10 -20 -30 -40 Oceania Japan East Asia South ASIA and South East Asia Change of forest area from 1995 to 2032 In MF, the deforestation will progress as the land is used for other purposes. In FW, the situation of forest will be more severe. On the other hand, PR society will advance the reforestation policy. In GT world, there are no advanced policies for reforestation, but protection of forest will be desired. As a result, the forest in PR and GT will be mitigated compared to MF society. In China, large-scale reforestation program is now proceeding. In PR, this reforestation program is reflected, but such large-scale program are not considered much in other regions. The estimation of land use change is based on the results from the general equilibrium model. As a result, in China in order to expand the forest area, the other land use, for example cropland, will decrease that affects food production. The gap between demand and supply of foods will be mitigated by international trade. In South Asia, in order to increase the export of foods, the land use for agriculture will be given the priority over the forest. Source: AIM
South Asia Afghanistan Bangladesh India Bhutan Iran Maldives Nepal Pakistan Sri Lanka Southeast Asia Brunei Darussalam Cambodia Viet Nam Indonesia Lao PDR Malaysia Myanmar Philippines Singapore Thailand East Asia China DPR Korea Japan Rep. Of Korea Taiwan Mongolia Central Asia Kyrgystan Tajikistan Turkmenistan Uzbekistan South Pacific Australia New Zealand Kazakhstan Fiji Kiribati Nauru Palau Papua New Guinea French Polynesia Tonga Vanuatu Samoa Solomon Islands 80% 70% 60% 50% 40% 30% 20% 10% 0% MF PR FW GT MF PR FW GT MF PR FW GT MF PR FW GT MF PR FW GT -10% -20% South Asia South East Asia East Asia Central Asia ANZ and South Pacific Change of water consumption by 2032 relative to 1995 Change of water consumption by 2032 relative to 1995 This figure shows the change of regional water consumption change by 2032 relative to 1995. Share of each country's contribution is also illustrated. The water consumption will increase as growth of population, economic development, and irrigated area. It will decrease as growth of efficient water-use technology. Because of the rapid growth of economy and water-supplied population, the growth of water consumption will be larger in the developing countries than in developed countries in all scenarios. In most developed countries such as Japan, water consumption can even decrease slightly in some scenarios. In MF, reflecting high-growth of economy and population, water consumption will increase especially in the industrial sector. It will also increase in the residential sector moderately, as water-use efficiency is improved. In FW, reflecting tremendously high-growth of population and very slow improvement of water-use efficiency, water consumption will increase very rapidly especially in the agricultural sector. Because of the low economic development, increase of industrial water consumption is lower in FW than in MF, even considering slow improvement of water-use efficiency. In PR, since institutional reform and other countermeasures are taken, water will be used in more efficient way in all sectors from early years of the considered period. The amount of water-use is controlled at the lowest level in the all scenarios. In developing countries, still there is a slight increase, however, it might be canceled out with the decreasing trend in the developed countries. In GT, very efficient water-use technologies can be introduced in the latter years of the considered period. The growth of water consumption will be kept at the moderate level, and even it may decrease in some developed countries. Source: AIM
m3/ha/year 1 50 250 1000 2000 FW PR Water consumption intensity in 1995 and 2032 in agriculture sector These maps show the water consumption intensity (water consumption in unit area). Consumption intensity is usually higher in highly populated area or intensively irrigated area. Water consumption in the fortress world increases sharply in agriculture sector, reflecting high growth of population and very slow improvement of water use efficiency. This trend will be improved in policy reform and great transition cases where water will be used more efficiently owing to institutional reforms and efficient water-use technologies. Source: AIM
0 7.5 15 30 60 100 (%) Total water consumption/annual renewable water resource in 1995 and2032 in MF and FW. MF FW Water severity index (national water consumption divided by national renewal water resource ) These maps show the water severity index. Here the water severity index is defined as the ratio of national water consumption to national renewable water resource. As the index reaches nearer to 100%, water scarcity problem is considered to happen more severely. Water severity will become worse in most countries, especially in South and Central Asia. Source: AIM