Download
1 / 51
510 likes | 640 Views
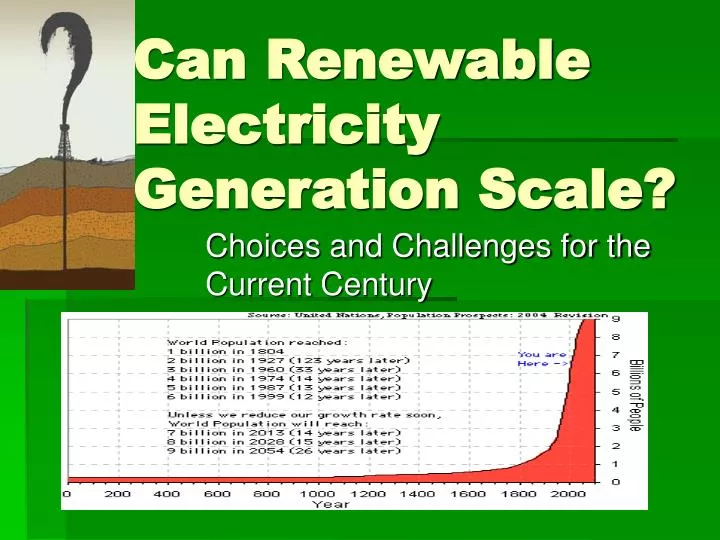
Can Renewable Electricity Generation Scale?. Choices and Challenges for the Current Century. Three Main Challenges. Electricity Production: per capita consumption is increasing faster than energy efficiency Developing Nations: 2 Billion humans are still without electricity

E N D
Can Renewable Electricity Generation Scale? Choices and Challenges for the Current Century
Three Main Challenges • Electricity Production: per capita consumption is increasing faster than energy efficiency • Developing Nations: 2 Billion humans are still without electricity • Electricity Distribution: Aging grid already at capacity; can’t easily accommodate new sources of generation
A Century of Change (1900 (=1) vs 2000) • Industrial Output: 40 • Marine Fish Catch: 35 • CO2 Emissions: 17 • Total Energy Use: 16 • Coal Production: 7 • World Population: 4 No More Fish by 2100 at this rate of Consumption
Electricity Demand Scaling • 1890 – 1955: D a P1.6 • 1955 – 2005: D a P3.5 (!) • US Nameplate Electricity Gen: 1.4 TW • World 4 +/- 0.5 TW (China Uncertainty) • 2050 Estimate by Pop Scaling: 12-16 TW • 2050 Estimate including improvements in electricity generating efficiency: 8- 12 TW
Why China is Such A Concern Factor 16 Growth (4 doubling times) in 35 years!
International Energy Outlook 2010 4 TW But this is Net Generation: Divide by 0.4 (40%) to Get to Nameplate
World Energy Use 2050 • Energy = electricity + transport + heat • Electricity Production: 30% of total Energy • So we need approximately 35 TW of Power in 2050 • Assume that as the annual average over 2000-2100 • We need energy source with 3500 TWyrs • Make an Inventory of Energy sources
Conventional Oil/Gas Unconventional Oil Coal Methane Clathrates Oil Shale Uranium Ore Geothermal Steam - conventional 1000 TWy (1/4 need) 2000 5000 20,000 30,000 2,000 4,000 Ultimately Recoverable Resource
Hot Dry Rock Sunlight/OTEC Wind Energy Gulf Stream Global Biomass 1,000,000 TWyrs 9,000,000 100,000 - 200,000* 140,000 10,000 Non Fossil Fuels 1.5 MW harvest devices Radiative transfer theory In Principle, Incident Energy is Sufficient but how to recover and distribute it in the most cost effective manner?
Not Considering Nuclear As Scalable • Current timescale from design through approval, construction and turn on for a typical 1200 MW reactor is 16 years ! • Insufficient Uranium Ore • Thorium reactors are certainly better but special handling conditions are required for Thorium and we have zero infrastructure for this
Scaling now becomes critical • Which renewable energy technologies scale the best in terms of unit yield, production timescales and material costs? • This need to properly scale is now coming at a time when civilization has essentially exhausted about 70% of available earth resources
More Earth Limitations • Total fuel cell production limited by amount of accessible platinum on the planet; 500 million vehicles lithospheric exhaustion in 15 years • Higher efficiency PVs limited by accessible amounts of rare materials (e.g. Tellurium, Sellenium, even Cooper) • Conventional Transmission media limited by available new Copper • Clear need for Carbon based materials (fiber, nanotubes) to overcome this.
This Decade (2010-2020) is Crucial: We must do much better than the Last Decade 1998
Evaluation Rubric For All forms of Renewables • 1. MW output per surface area (MW/KM2) • 2. MW output per material use (MW/Ton) • 3. MW output per job created (Jobs/MW) • 4. MW output versus production time scale to bring on line (months/MW) • 5. Capital cost per MW ($/Watt) • 6. Realistic Levelized Cost (cents per KWH)
20 KW power buoy 5 MW Wind Turbine LNG closed cycle Wind Farm (3Dx6D) Solar Trough Pelamis Farm 850 Tons per MW 100 Tons per MW 1500 MW sq km 50-60 MW sq km 20-25 MW sq km 30-35 MW sq km Dollars Per Megawatt per unit Land use per unit Material Use
To Evaluate Competing Electricity Generating Technologies • Develop an internally consistent indexing system for the 6 attributes listed previously (the dow jones is an index) • Use real world data and real world physics to best determine the values • Weight the indexes appropriately (real world cares about $/Watt and Jobs Created) • Choose Baseline – we will use Solar in the following exercise
Indexing – Solar Troughs • 1. Land ~20 MW/km (over 24 hour day) = 1 • 2. Materials ~3 tons per kw = 1 • 3. Jobs ~3 jobs per MW • 4. Time ~10 MW per month • 5. Capital ~3$ per watt real facility cost • 6. Levelized 10 cents per KWH
Cumulative Index = 1+2+(1.5)3+4+1.25(5)+1.25(6) Highest Index is Best
Relative Ranking • Solar = 7 • Waves =4.75 • Biomass =11 (because of jobs created) • Wind = 17 (lower material intensity and low Levelized costs) • In general, wind is more scalable than Solar and wind always beats Solar PV
Gulf Current Total Yield • Ocean currents have approximately 830 times the energy density of moving air (i.e. wind). For a 2 m/sec current, the power density is 4 KW per square meter. • Assume underwater array of 3 blade turbines with blade length of 2 meters. That means 50KW unit capacity. • Build a 1 km leg with turbines spaced by 4 meters. Each leg then has 250 units x 50 kw = 12.5 MW per km. • Build parallel legs over a 10 km wide section which each leg separated by 100 meters 1.25 GW in this 1x10 x-section • Now repeat this over 100 km of Gulf stream and you have 125 GW. Repeat this over 1000 km and you have 1.26 TW (or equivalent of US Total nameplate capacity) Gee, Isn't this a solution?
Scalability in the Real World • Energy Payback Times (EPT) • Material supply chain limitations • Good current example – Lithium for Li-Ion batteries. 1 Kg per laptop (200 million per year) 250 KG per EV
Current World Build Out Annual Growth Rate is 22%
Looks Good but .6 TW by 2020 will only be about 10% of total nameplate production
Wind Reality • 144,000 MW installed capacity is about 44,000 MW real produced (capacity factor of 0.31) about 1% of global now • A 10% goal can reached in 2018 but would require production to be 5 times higher than now • Its unclear at the moment, which aspect of wind turbine construction can’t scale to meet this goal • Transmission line limitations, may be the limiting factor unless we start using HYDROGEN as the energy carrier
Real World Wind Example: • 3600 turbine blades per year • Requires 2500 workers • Requires 2 x 400,000 sf facilities. • 1200 2.5 MW wind Turbines per year • 3000 MW per year 115 yrs to replace 340,000 MW of Coal (NP) • Need to ramp this up by a factor of 6 to replace all Coal (NP) by 2030
Solar: Harvesting a Vastly distributed Resource A Large Scalability Challenge
Wind vs Solar • Wind has a materials only supply chain • Solar PV has a chemical processing component
Solar Trough Supply Chain • Is mostly in materials, similar to wind supply chain process:
Solar Growth 29% annual growth rate
Reality: Solar • 18000 annual MW of Peak is closer to 3000 MW of average annual • Current Global is ~4.8 TW or 1600 times larger • Supposed Global electricity growth is 2.5% • By 2027 10% electricity would come from PVs which would now be produced at the rate 60 times greater than now in just 17 years! not possible
Real World • Hard to predict how scalable an industry really is • Averaged over next 25 years solar is likely to be around 15% due to various material limitations • Wind is likely to be only 10% due to material limitations and production physical space and transportation/distribution constraints • With these rates by 2035 and a 9 TWe planet • Solar = 8% • Wind = 50% • So 2050 Renewable Energy Planet is possible if one includes the gulf current projet.
Energy Pay Back Times • Energy Payback Time the timescale over which the total supply chain energy of manufacturing is paid back by harvested energy from the device. • EPBT for Solar PV at best is 2.5 years: This depends primarily on PV efficiency and PV insolation • EPBT for Wind Turbine is now at about 3-4 months: This depends mostly on turbine capacity. The energy required to make a 3 MW turbine is a lot less than 2 times the energy it takes to make a 1.5 MW wind turbine. • The bottom line here is that, in every way measureable, Wind is more scalable than Solar PV. • But, the energy payback times of concentrating solar power systems (e.g. solar troughs) is comparable to wind energy (5-8 months) because that technology has a similar material supply chain it just doesn't have the land use scalability of wind.
Molecular Storage Containers • Current best molecule is Ca32C60 • Molecular weight is high so addition of H does not increase weight significantly Major Physics Problem: You can put the Hydrogen in But you can’t get it out Fast enough to Power a Fuel Cell
Thinking Big -Solar • Sonoran Desert Project: 300,000 square km @ 2% coverage yields 100,000 MW 10% coverage yields 500,000 MW
Thinking Big - Wind Lake Michigan Wind project down North South Axis: Populate 400 x 30 km box with 30 legs each containing 1200 5 MW turbines: 180,000 MW
Thinking Real Big - Wind Great Prairie Wind Farm with 100 MW vertical Wind Turbines: Construct 10,000 of these (Space Needle Size) @1 per 125 square km. This produces 1TW of electricity and effectively replaces all other forms of electricity generation in the US.
Thinking Real Big – Aleutian Wind Wall TW wind power scale incident on the Archipelago (nearly constantly) (wind power density averages 600-700 watts per sq. meter – twice as high as typical wind farm. Use this wind energy to produce Hydrogen (can annually fuel at least 100 million vehicles should they exist)
The Necessary Smart Grid • Route electricity like IP • Each node on network can buy, sell, or store electricity • 100 million network nodes – each home is a power plant • SMS messaging on system state; poll once every 2 minutes 4 Terrabits per second
Summary • Yes this is a big infrastructure challenge. Need to install 50,000 MW per year for 20-30 years. This is not physically impossible. Big infrastructure can be built if you put enough resources into it: The Interstate Highway System The Depression Era Federal Hydroelectric Projects (45% green) Going to the Moon in 10 years • Think seriously about using Hydrogen as a proxy for transmission of electricity within the new smart grid • No one technological solution (e.g. fusion) yet exists need Network of regionally based alternative energy facilities