Download

1 / 33
330 likes | 457 Views
Field water balance of final landfill covers: The USEPA’s Alternative Cover Assessment Program (ACAP). William H. Albright Desert Research Institute, University of Nevada and Craig H. Benson University of Wisconsin-Madison. Final covers - the issues. Lack of field-scale performance data

E N D
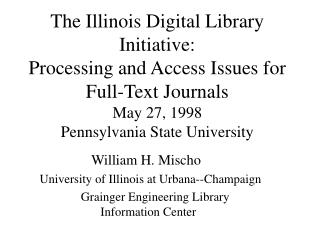
Field water balance of final landfill covers: The USEPA’s Alternative Cover Assessment Program (ACAP) William H. Albright Desert Research Institute, University of Nevada and Craig H. Benson University of Wisconsin-Madison
Final covers - the issues • Lack of field-scale performance data • Excessive uncertainty in modeled predictions • No specified design process Presented here... • Field data from ACAP • A suggestion for acceptable use of models • A design process for engineers and regulators
ACAP: The Field Program • Nationwide: 11 sites, 7 states • Large (10 X 20 m) drainage lysimeters • Conventional covers • Composite • Soil barrier • Alternative covers • Evapotranspiration (ET) • Capillary barrier • Side-by-side demonstration at most sites
Apple Valley CA Monterey CA Altamont CA Boardman OR Polson MT Omaha NE Cedar Rapids IA m 0 Geomembrane over geosynthetic clay layer Geomembrane over fine-grained soil layer 0.3 0.6 0.9 1.2 1.5 Conventional Composite Designs
Precipitation Lateral flow Surface flow Percolation Water Balance ComponentsConventional Composite Cover, Cedar Rapids IA • Percolation rate correlated with • Heavy precipitation events • Surface flow • Lateral flow on geomembrane
Surface flow Percolation Precipitation Lateral flow Water Balance ComponentsConventional Composite Cover, Marina CA • Percolation coincides with precipitation, surface and lateral flow • Relatively high rate of percolation • No cushion between the geomembrane and the soil, punctures likely in geomembrane • Illustrates importance of careful geomembrane installation
Conventional Composite CoversDiscussion • Perform well at all locations • Average percolation typically <1.5% of precipitation • <1.5 mm/yr at arid/semi-arid/subhumid sites • <12 mm/yr at humid locations • Percolation often linked to heavy precipitation events and lateral flow • Damage to geomembrane greatly increases percolation rate • Construction practice and quality control are very important
Apple Valley CA Cedar Rapids IA Albany GA m 0 0.3 0.6 0.9 1.2 1.5 Conventional Soil Barrier Designs
Soil water storage Precipitation No rain Percolation 3/4/02 Water Balance ComponentsConventional Soil Barrier Cover, Albany GA • Soil dried for first time during 6-week drought • Change in response of percolation to precipitation events • Quantity • “Stair step” response mm water • No evidence that defects in clay barrier healed when soil water increased
Hydraulic Conductivity (K) (cm/s) Kf/Ko Test As-Built 1.0 4.0x10⁻⁸ SDRI 5000 2.0x10⁻⁴ TSB - 1 1300 5.2x10⁻⁵ TSB - 2 800 3.2x10⁻⁵ TSB - 3 77,500 3.1x10⁻³ Change in saturated hydraulic conductivity in a compacted clay barrier • Albany GA • Cover installed March 2000 • Final sampling Feb. 2004
Conventional Soil Barrier CoversDiscussion • Percolation at humid locations • 52 - 195 mm/yr • 6 – 17 % of precipitation • Percolation response to precipitation events changed at both humid sites • Percolation quantity increased • Temporal response increased • Clay barrier properties changed significantly over a relatively short time
Alternative Designs: Arid/Semi-Arid/Sub-Humid Locations Marina CA Boardman OR Apple Valley CA Sacramento CA Polson MT Helena MT Monticello UT Alta- mont CA m 0 0.3 0.6 0.9 1.2 1.5 1.8 2.1 2.4 2.7 Capillary barrier designs
Soil water Surface Runoff Precipitation Percolation Water Balance ComponentsAlternative Cover, Helena MT • Seasonal precipitation pattern • Seasonal fluctuations in soil water content • No percolation
Soil Moisture Precipitation Percolation Water Balance ComponentsAlternative Cover, Marina CA • Water storage capacity lower than expected • Effective storage capacity (300 mm) lower than calculated (385 mm) • Drainage when storage capacity exceeded
Omaha NE Cedar Rapids IA Albany GA m 0 0.3 0.6 0.9 1.2 1.5 Alternative Designs: Humid Locations
Water Balance ComponentsAlternative Cover, Omaha NE • Moderate precipitation • Percolation occurs late spring • Improvements in design and factor-of-safety considerations may provide acceptable performance Precipitation Soil water Percolation
Soil water Precipitation Percolation Water Balance ComponentsAlternative Cover, Cedar Rapids IA • High precipitation • Extended periods when precipitation > ET • Probably exceeds capacity of soil/plant system to achieve low percolation rates (mm water)
Alternative DesignsDiscussion • Very low (<2mm/yr) percolation rates at 7 of 10 covers at arid/semi-arid/sub-humid locations • Annual variation in transpiration capacity at Sacramento CA cause of anomalous behavior • Insufficient soil water storage capacity at Marina CA • Higher (33-160 mm/yr) percolation rates at humid locations. • Preliminary calculations of water holding capacity can underestimate apparent capacity by 0-25% • Successful design requires careful attention to: • Site characterization • Water balance mechanisms
Sensitivity analysis as a design tool • Design sensitivity analysis (DSA) is performed by comparing results from systematic variation of a single parameter • DSA helps designer and regulator understand relative contribution of various design features or environmental stresses to cover performance • DSA can provide valuable information for negotiations in a regulatory environment
A design process from the Interstate Technology Regulatory Council (ITRC) • Define performance criteria • No flux • Bioreactor operation • Select and validate design concept • natural analogs • lysimeter data (ACAP) • Characterize site (soil, plants, climate) • Model with DSA to understand important design parameters and environmental stresses • Final design considerations (final land use, etc) • www.itrcweb.org