Download
1 / 25
250 likes | 380 Views
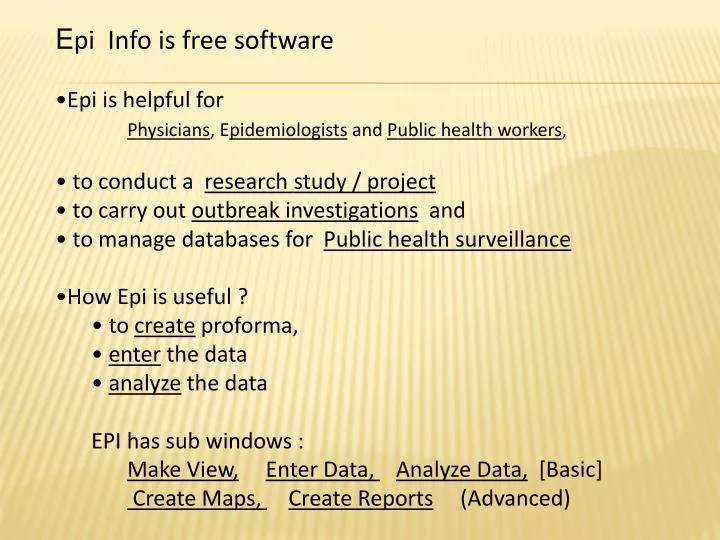
E pi Info is free software Epi is helpful for P hysicians , E pidemiologists and P ublic health workers , t o conduct a research study / project to carry out outbreak investigations and to manage databases for Public health surveillance How Epi is useful ?

E N D
Epi Info is free software • Epi is helpful for • Physicians, Epidemiologists and Public health workers, • to conduct aresearch study / project • to carry out outbreak investigations and • to manage databases for Public health surveillance • How Epi is useful ? • to createproforma, • enter the data • analyze the data • EPI has sub windows : • Make View,Enter Data, Analyze Data, [Basic] • Create Maps, Create Reports (Advanced)
Make View : to create a blank Proformaof the study with all the relevant variables/fields Enter Data: Here we enter the data(from the records /case sheets of the patients) Analyze Data : Here, we bring out the tables one way, or two way frequency tables , draw diagrams, and do statistical analysis. Based on these results we infer the results.
Creation of proforma / Make View for a study • Let us create a proforma for an hypothetical study to find “Prevalence of obesityamong the patients aged 15+years attended KKUH in the year 2010” • We have to decide the relevant variables to include before creation of proforma. • For the time being, let the variables be, Id No., age, gender, height(in meters),weight(in kg),marital status
Proforma/Questionnaire/Schedule Study of obesity in KKUH in 2010 ID Number:___________ Age(years):_____ Gender: M F Height:________(meters) Weight:________ (Kgs) Marital status: Married(y) Not married(n)
Let there were 2000 patients attended KKUH last year. • Then we print 2000 blank forms like this and collect the data from the case sheets of the patients. • Now we have 2000 filled in forms. Now we have to enter the data from the forms into the computer. • In EPI also , first we have to create blank proforma. Here we call it view. • to create View, select Make View, in the EPI main window and • you get a ''Make/Edit view', screen
As this is a first step , we have to specify file name of our study in ‘New’ as ours is a new study. • Let the File name be, Obesity in KKUH patients in 2010 • (Remember source folder where it is stored, or you can specify your folder to store this file name). • Then you get a small window asking for 'name of the view', let us give v1, also remember name of the view • You get an empty page with small grids. Here we have to create our proforma with all the variables.
General procedure to create any variable in the view is: • Right click anywhere on the screen, you get a small window ‘Field Definition”. • Here, first give name of the field in 'question or prompt', then choose type of variable. • If qualitative variable, select text and also width of the text. If quantitative variable, select number and number of digits (in terms of ####), then finally give ok.
the above window shows “view” with one variable. Similarly, we have to enter the other variables of the study. Once all the variables are entered in the page, it looks as follows. • Now, Save this view/proforma and give “Enter”. • Now it will ask name of the data table ( where the data has to be stored ) • for this study and give some name – v1t and remember it and note down.
NB: • 1. For qualitative variable, it is better to give codes along with the field name it self. For example for the variable Gender , enter (m/f) adjacent to field name itself , so that we may not forget what to enter at the time of data entry) • 2. If you want to change or to correct the name of the variable or type of variable later, double click on the variable name you get the same window similar to while creating the variable, do the correction and give ok. • 3) Using right click on the variable name and holding it • we can drag the variable to any place in the screen • 4) we can reorder the variables horizontally or vertically by selecting first ‘FORMAT’ and then ‘Alignment’ and then horizontally or vertically. • We can give title of study also. Procedure is the same as creation of variables, but in type of variable we select 'TITLE/LABEL'
B ) Data entry • Go to main window and select 'ENTER DATA‘ and you get a Enter data screen • From ‘File’, you select the view ‘v1'created for this study. • Proforma with all the variables we created will appear with blank fields as follows. • Now we have to enter the data of first patient. We can see in left bottom record number. • Enter the data for the variables one by one. To move from variable to other variable, use Enter key • Like this enter the data carefully for all the patients. At the end of all the records • Exit the data entry screen. Now the data entry is over. • The data is stored in the table v1t and our proforma/view name is v1
C ) Analysis of data: We will be doing analysis of the data in this screen. From Epi Main window, select 'Analysis' icon. You will see the screen like this. It has 3 small windows. In this window there are 3 subwindows. In the first we have series of commands on the left side. In the second, “output” window the results in the form of one way or two way tables, descriptive statistics will appear once the commands are executed. In the third, Proram Editor window: In this window, program lines will be shown whatever commands we have executed. Ignore this window for the time being.
In Analysis window , • USING DATA COMMAND, we can import the data file, merge data files and write the data files to disk • USING VARIABLES COMMAND, We can create new variables with the existing variables. • we can select all records or some records with some criterion for the analysis USING SELECT/IF COMMAND • We can see the data, we can bring one way and also two way frequency tables with or without percentages, and do appropriate statistical tests USING STATISTICS COMMAND • Statistical analysis like Linear regression, logistics regression, survival analysis, cluster sampling analysis USING ADVANCED STATISTICS COMMAND • -------------------------------------------------------------------------------------------- • Let us import our data file and execute Table command and bring one way two way tables for our data.
Go to analysis window and click read/import file command and we get READ window • In this window, in “Data Format”, select Epi 2000 because we have entered the data in EPI. • [If we have entered the in Excel , we have to select Excel format] • next go to Data Source , you select the view filename • Next, select name of our view ,v1and give ok. • And we see our table name v1t ,select it and give ok. • .Next we get a small READ window with TMPLNK_9. Here simply click ok. • Now our data file is read and in the next screen we can see number of records in our file
we can see the screen with file name and number of records • and date and time created as shown here. • Now , we can see our data by selecting List command.
Now, to get two frequency table of age by gender, we select Tables command. • select age variable in ‘Exposure Variable’ and Gender in ‘Outcome variable’ • and in settings we select ‘None’ in ‘statistics’ and ‘show tables in output’ and donot select ‘show Percents’ and also ‘show graphics’. and give ok and we get output.
This is the Output of two way frequency table • If we want only one way table, select Exposure variable and leave blank in “outcome variable” • To get one way table we can use “FREQUENCIES” COMMAND also. If we want percentage in the table, select ‘show percents’ • in settings itself • if we select “statistics” and ‘intermediate’ , we get chisquare test with p value in the output
To get mean and sd for a quantitative variable, select MEANS command and we will get No.of observations, Total, mean, variance, sd, min, Q1, median, Q3, max, mode. In settings select only ‘intermediate ‘ in statistics.
you can derive new variables in Variables command with the existing variables . For example we have height and weight variables and we want new variable BMI as weight/(Height^2), • First DEFINE new variable BMI using define command. Then select ASSIGN command. Here give BMI= weight/(Height^2). New variable BMI has been created in the data file. Using BMI we can do further analysis.
we can recode the present variable into new variable. for example we have single year ages, and we want age groups as our new variable . we can do this by Recode command. • First define the new variable ‘AGEGRP’ using DEFINE command. Then use Recode command. Here give old variable ‘ageyrs’ and new variable ‘agegrp’ as shown in window and create age groups as shown in window and give ok . New variable ‘agegrp’ has been created with the given age intervals.
To Convert dates of birth into age values Step1 DEFINE AGE as numeric variable # # # Step 2 Press ENTER Step 3 Using Assign command , create AGE = ("01/02/2003" ± DOB) / 365.25 Step 4 Press ENTER You have now created a numeric field called AGE and converted all of the dates of birth into age values in whole years and placed them in the AGE field. This will represent the ages of patients at 1 February 2003.
Some Hints: • NB: 1. In Means command , t test and Anovacan also be done. For t test you should have two categories and for Anova you should have more than two categories. • NB 2. While executing each command , select what you want in settings, else the output will be full of tables ,percentages, and graphs. • NB3. We can analyze a part of the data also depending up selection of records on some condition using select/If. • NB4. If we want the output in a file , in the beginning of executing the Analysis command, give the output file name inRouteoutcommand and remember it, Else output what we see in results window will disappear once you exit the Analysis window. • Finally, for any help needed, one can see HELP command in the particular Epi window for clarification.
Exercise : • Think of some small hypothetical study and • create bothqualitative and quantitative variables and • collect hypothetical data . • Create view for your study and • enter the data in Epi and • bring one way table and two way table for qualitative variables and • find mean ,median, mode, sd, variance for the quantitative variables.