Download
1 / 28
280 likes | 410 Views
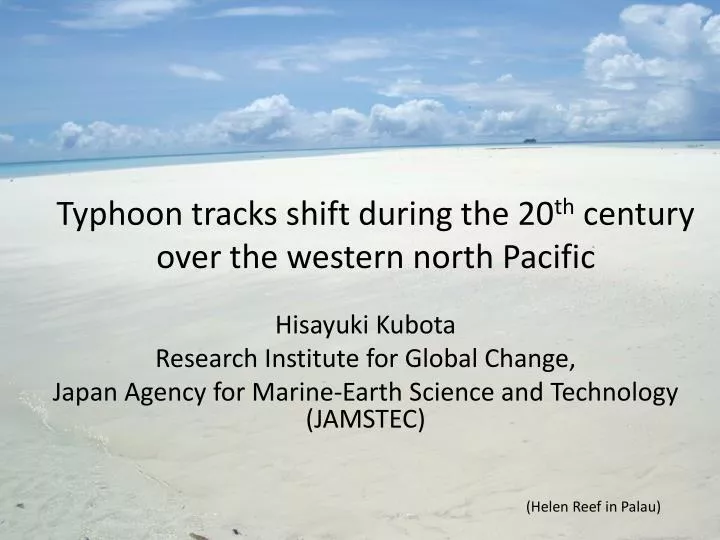
Typhoon tracks shift during the 20 th century over the western north Pacific. Hisayuki Kubota Research Institute for Global Change, Japan Agency for Marine-Earth Science and Technology (JAMSTEC). (Helen Reef in Palau). Acknowledgements Data Integration & Analysis System (DIAS)

E N D
Typhoon tracks shift during the 20th century over the western north Pacific Hisayuki Kubota Research Institute for Global Change, Japan Agency for Marine-Earth Science and Technology (JAMSTEC) (Helen Reef in Palau)
Acknowledgements • Data Integration & Analysis System (DIAS) • Global Environment Research Fund B-061 • Grant-in-Aid for Scientific Research 20240075 and 21684028 Cooperation with • Central Weather Bureau, Dr. Mong-Ming Lu • Philippine Atmospheric Geophysical and Astronomical Services Administration (PAGASA), Dr. Susan R. Espinueva • Hong Kong Observatory, Mr. Edwin W. L. Ginn • Shanghai Typhoon Institute, Dr. Zhao Bingke Collaborators • Prof. Bin Wang (International Pacific Research Center, University of Hawaii) • Prof. Johnny C. L. Chan (Guy Carpenter Asia-Pacific Climate Impact Centre, City University of Hong Kong) • Dr. Mong-Ming Lu (Central Weather Bureau) • Prof. Jun Matsumoto (JAMSTEC/ Tokyo Metropolitan University) • Dr. Kooiti Masuda (JAMSTEC) Sharing historical data with • Dr. KumiKataoka (Shumei University) • Prof. Chih-Wen Hung (National Taiwan Normal University) • Dr. Joo-Hong Kim (National Taiwan University)
Intensified TC increases associated with the increase of SST However Chan (2006) insists TC trends is a part of inter-decadal variability. Longer dataset is needed to understand TC variability further. Emanuel (2005) PDI: Power Dissipation Index
Atlantic Ocean temperature and TCs trends Knutson et al. (2010)
Available global tropical cyclone track datasets 1945- 1851- 1877- 1949- 1877- by NCAR
Purpose • Historical typhoon track data are collected back to 19th century over the western North Pacific. • Typhoon track dataset for 100 years is created over the western north Pacific. • Typhoon variability is investigated during the past 100 years.
Monthly Bulletins of Philippines Weather Bureau (1901-1940) stored in Hamilton Library at University of Hawaii 300 stations observation data Typhoon tracks over the WNP Udias (1996) BAMS Introducing 19th-20th century meteorological observation over the world Philippine weather observation Spanish (from 1865) American (20th century) meteorologists collected 2007-2008
First observation of TC passage by instruments at Manila in Sep 26-28 1865 barometer temperature humidity wind direction Deppermann (1939)
Typhoon track and surface isobar map on May 1913 Typhoon tracks were detected by using station observations, ship observations reports of typhoon eyes and damages.
Taiwan TC track data Available data: TC location, central surface pressure, maximum wind speed 1897 and 1898 Shieh et al. (1998) received from CWB on 2008
Seasonality of typhoon track 1893-1918 Major four typhoon track dataset were used (Philippines, Japan, Hong Kong, and Zi-ka-Wei) Visher 1922 MWR
Historical typhoon track data collected and digitized over the western north Pacific digitized collected available Hong Kong (Hong Kong Observatory) (1958 reedited) Shanghai(Zi-Ka-Wei) (Shanghai observatory) (1957 reedited) Philippines (Univ. Hawaii) Japan (JMA library)
Digital Tropical Cyclone tracks over the Western North Pacific from 1902 to 1940 Data source Monthly Bulletins of the Philippine Weather Bureau 1901-1940 Datasets TC (tropical cyclone) track locations Data files TYByyyymmdd.a.dat (for example: TYB19020706.a.dat) yyyymmdd: It is the first date of each TC track. • Data format • YYYYMMDDHH lat lon type flag • 1902 7 6 12 12.19 128.34 2 1 • 7 7 12 12.25 125.63 2 1 • 1902 7 8 12 12.57 123.54 2 1 • 1902 7 9 12 13.36 121.16 2 1 • 1902 7 10 12 14.70 118.30 2 1 • 7 11 12 17.09 114.66 2 1 • HH: Philippine local time (+8 hours GMT) This data is available at http://www.jamstec.go.jp/drc/maps/e/kadai/mon/mon_tt.html
Typhoon definition compared by landfall numbers in the Philippines To check the reliability of the historical datasets • 1945-2005 when TS passed over Philippines Max wind speed >35kt (JTWC TS best track data) (JMA best track data used for comparison) • 1902-1939 when TS passed over Philippines ps <1000hPa observed at station using Monthly Bulletins of Philippines Weather Bureau Comparison between two definitions Typhoon landfall from 1951-1978 by “Tropical Cyclones Summaries from 1948 to 1978” Max wind speed >35kt TS 124(JTWC), 124(JMA) Ps<1000 hPa107 105 (difference 13.7%, 15.3%) Kubota and Chan (2009)
Quality check of the density of typhoon numbers over the WNP • Restrict the target area, within • 600km radius of each weather station • Check typhoon passage through • the perturbation of the station • pressure data 80% of typhoons passed target area (JTWC, JMA) Count enough numbers of typhoons throughout the year near Philippines from 1908 ▼ : typhoon by Philippines dataset ▼: typhoon by Hong Kong dataset ▼: typhoon by Japan dataset ▲ :typhoon landed Philippines
Typhoon track dataset over the target area1910-2009 Combination of Philippine and Japan dataset -1939 Philippine Weather Bureau 1940 Japan (Central Meteorological Observatory of Tokyo Japan) 1941-1944 data missing 1945-2009 Joint Typhoon Warning Center
Historical daily rainfall dataset created from early 20th century Korea 1904-2008 Japan 1888-2009 Manila Central Observatory + PAGASA Taiwan 1897-2009 Philippines 1891-2009 South Seas Bureau & WNP islands 1923-2009 Hong Kong 1884-2010 South Sea Bureau+PACRAIN
Typhoon numbers of the target area over the Western North Pacific MBP+CMOJ JTWC JMA :10 years running mean 10-20N >20N <10N MBP, JTWC JMA
Trends in typhoon numbers 5°×5°boxes ▲:95% significant ▲:99% significant
Typhoon numbers differences (1910-39), (1980-2009) 1910-39 1980-2009 Total annual 20.2 (1910-39) 20.5 (1980-2009) ▲:90% significant ▲:95% significant
Discussions Typhoon frequency difference (El Niño – La Niña) •: 95% significant
Weakening of Walker circulation during 20th century SLP Trends from 1861 from 1992 Vecchi (2006)
Eastward intensification of low-level westerly wind over tropical western Pacific Trends from 1950 to 2008 Tokinaga et al. 2011 submitted
Summary • Historical typhoon track dataset during the 20th centuryis created. Collect historical typhoon track data during the early 20th century Digitize the data reported in books Perform the quality check compared to the present data Connect the data with the present available data • Typhoon variability during the past 100 years is investigated. Typhoon numbers have inter-decadal variability but no trend over the target area of WNP. Typhoon tracks have trends during the 20th century . Typhoon track tends to shift northward from low latitude to higher latitude, and eastward from coastal region along Philippines Sea to the eastern region during the past 80 years. To explain the typhoon track shift pattern, we need further discussions.
Taiwan and Okinawa, HadSLP sea level pressure JJA HadSLP Taiwan, Okinawa 21years running mean correlation +1000hPa
Historical northern hemisphere Weather map Stored in JMA library 1899-1956 By US Weather Bureau