Download
1 / 31
310 likes | 404 Views
San Francisco Estuary Institute. Item #1a. Exploratory categorization of watersheds for potential stormwater monitoring. Ben Greenfield, Marcus Klatt, Lester McKee Sources Pathways and Loadings Workgroup May 6 th 2010. San Francisco Estuary Institute. Item #1a. Topics.

E N D
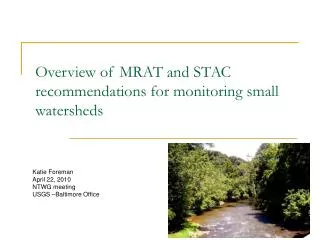
San Francisco Estuary Institute Item #1a Exploratory categorization of watersheds for potential stormwater monitoring Ben Greenfield, Marcus Klatt, Lester McKee Sources Pathways and Loadings Workgroup May 6th 2010
San Francisco Estuary Institute Item #1a Topics • Categorization of watersheds • Watersheds for long term monitoring
San Francisco Estuary Institute Item #1a Background – Trend Monitoring Goals • Which Bay tributaries contribute most to Bay impairment from pollutants of concern (POC) • Quantify annual tributary POC loads or concentrations • Quantify the decadal-scale POC loading or concentration trends • Quantify the projected impacts of management actions (including control measures)
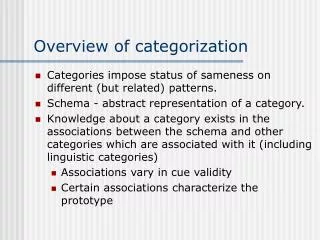
San Francisco Estuary Institute Item #1a 1. Categorization of Watersheds • Develop rationale for initially classifying Bay Area small tributary watersheds into a small number (<10) of categories for monitoring • Provide STLS stakeholders with a tool to develop and rank a list of representative watersheds in each class
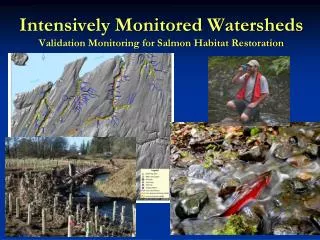
San Francisco Estuary Institute Item #1a Study Area • 185 watersheds included • Focused on areas with best available data • Potential for expansion after data development to new areas
San Francisco Estuary Institute Item #1a Approach • Compile GIS with land use history and other attributes • Scaled and transformed data • Cluster analysis to determine watershed categories • Ward’s minimum variance method with Bray-Curtis dissimilarity • Used eight clusters • Non-metric Multidimensional Scaling - evaluate key distinguishing features of watersheds
1995 Land Use % Industrial % Residential % Commercial % Agriculture % Open 1954 % Industrial % Impervious Current and historic railroads (RR) Watershed area Population/area PG&E facilities/area Pump stations/area Auto dismantlers/area Annual precipitation avg. UTM spatial coordinates San Francisco Estuary Institute Item #1a Metrics Included
Clustering by • Size • Land use – industrial vs. open • Imperviousness • Attributes • RR • PG&E • Pump stations
Watershed variation: • Imperviousness • Industrial vs. open • Railroads
Cluster 1: • Small – highly urbanized
Cluster 1: • Small – highly urbanized • Cluster 2: • Moderate size • Urbanized, PG&E, RR
Typical small and moderate sized watersheds Cluster 1 41 watersheds Cluster 2 43 watersheds
Cluster 1: • Small – highly urbanized • Cluster 2: • Moderate size • Urbanized, PG&E, RR • Cluster 6 • Large with more open space
Typical large watersheds Cluster 6 22 watersheds
2. Watersheds for long term monitoring • Municipal Regional Stormwater NPDES Permit (MRP) lists watersheds for long term monitoring • How do they fit together? • Representative of urban/industrial source signals • Current data/leverage • Feasible to monitor • Address monitoring questions
San Francisco Estuary Institute Item #1a MRP –Monitoring Questions • Which Bay tributaries contribute most to Bay impairment from pollutants of concern (POC) • Quantify annual tributary POC loads or concentrations • Quantify the decadal-scale POC loading or concentration trends • Quantify the projected impacts of management actions (including control measures)
San Francisco Estuary Institute Item #1a MRP Loads Monitoring Watersheds • Guadalupe River Cluster 6 • Walnut Creek Cluster 7 • Zone 4 Line A Cluster 1 • Castro Valley Creek • Rheem Creek – Richmond Cluster 1 • Calabazas Creek –Santa Clara Cluster 1 • San Mateo Creek Cluster 2 • Laurel Creek – San Mateo Cluster 1
Cluster 6 – large watershed Varied land use Extensive long term monitoring data Planned Hg and PCB TMDL management actions San Francisco Estuary Institute Item #1a Guadalupe River
Cluster 7 – large watershed (368 km2) Mostly open and residential land use Attributes of Cluster 6 Current/prior monitoring data? Planned management actions? San Francisco Estuary Institute Item #1a Walnut Creek
Cluster 1 – small watershed (8.8 km2) 44% industrial land use 4 yr monitoring data Few planned management actions Limited land use change “Control” watershed San Francisco Estuary Institute Item #1a Zone 4 Line A
Small watershed (14.2 km2) Predominantly low density residential (50%) with some open (35%) USGS long term flow, discharge, and stage monitoring Copper and TSS monitoring in WY2004 San Francisco Estuary Institute Item #1a Castro Valley Creek
San Francisco Estuary Institute Item #1a Discussion • What is an appropriate subset of watersheds to focus on for WY 2010 sampling? • How appropriate are the watersheds listed in the MRP for initial sampling to meet the MRP objectives? • What other factors should be considered in watershed selection?