Download
1 / 12
210 likes | 684 Views
Sound and Intensity. Transverse vs. Longitudinal Waves Sound Frequency Sound Loudness Loudness and the Decibel Scale db Examples Other db scales. Transverse vs. Longitudinal Waves. String (transverse) wave animation https:// sites.google.com/site/physicsflash/home/transverse

E N D
Sound and Intensity • Transverse vs. Longitudinal Waves • Sound Frequency • Sound Loudness • Loudness and the Decibel Scale • db Examples • Other db scales
Transverse vs. Longitudinal Waves • String (transverse) wave animation https://sites.google.com/site/physicsflash/home/transverse • Air (longitudinal) wave animation https://sites.google.com/site/physicsflash/home/sound • Wavelength – distance between peaks at fixed time • Frequency – time between repetitions at fixed position • Velocity from wavelength and frequency
Transverse vs. Longitudinal Slinky • Transverse vs. longitudinal waves http://www.animations.physics.unsw.edu.au/jw/sound-pressure-density.htm • Transverse • Longitudinal
Transverse vs. Longitudinal Comparison • Transverse vs. Longitudinal Waves http://faraday.physics.utoronto.ca/IYearLab/Intros/StandingWaves/Flash/long_wave.html
Comparison of waves on string and air • Both have • Wavelength – distance between peaks at fixed time • Frequency – rate of repetitions at fixed position (like your ear) • Wave velocity • Differences • String wave velocity varies with tension and mass/length • Air wave velocity set at 343 m/s (at 20° C) * *at any temperature )
Frequency (pitch) of sound waves • Frequency (pitch) of sound waves http://www.animations.physics.unsw.edu.au/jw/sound-pitch-loudness-timbre.htm http://www.animations.physics.unsw.edu.au/jw/frequency-pitch-sound.htm • Human ear ~ 20 Hz to 20,000 Hz (dogs higher)
Loudness (volume) of Sound Waves • Loudness (volume) of sound waves http://www.animations.physics.unsw.edu.au/jw/sound-pitch-loudness-timbre.htm • Human ear can hear from about 10-12W/m2 to 100 W/m2 - about 14 orders of magnitude!
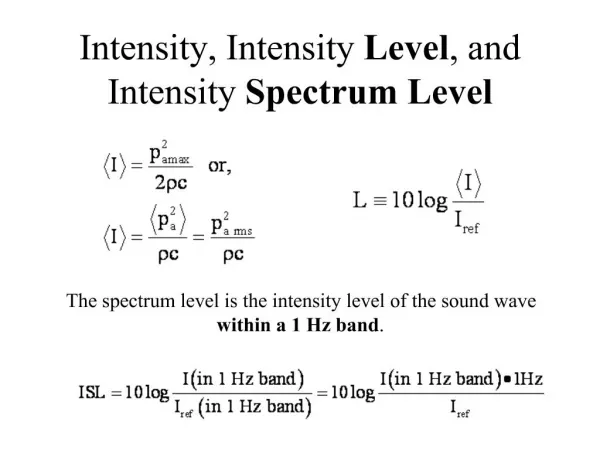
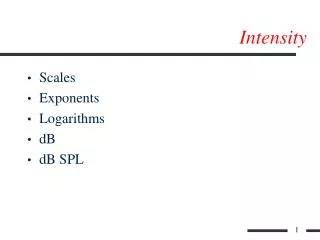
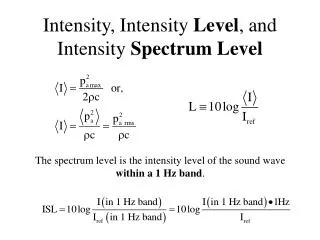
Intensity and decibel scale • Range of human ear Intensity 10-12 – 100 watts/m2 • Make scale more convenient - “compress” this • Try Logarithms • Method 3 gives most convenient scale • Definition decibel (sound)
Example - Intensity and db scale • Auto interior sound intensity 3 x 10⁻⁵ W/m2. What is decibel level? (use calculator) (fractional logarithms OK) • The sound level for a jet plane at takeoff is 140 db. What is the intensity? () Logarithm rules on textbook inside back cover
Example 12-4 – Loudspeaker volume • 3 db Intensity difference (difference/quotient rule)
Example 12-5 – Airplane roar • Translate 140 db at 30 m to intensity • Scale from 30 m to 300 m using inverse square law • Translate at 300 m back to db
FYI - Other “Decibel” scales • Sound db - referenced to 10-12 W. • Electrical dbm - referenced to 10-3 W. • 2G/3G/4G/WIFI signal strengths (WIFI > -20 dbm near router.) • Comcast checks cable modem this way. • db always log of power ratio to some reference power. Cellphone signal strengths