Download
1 / 69
690 likes | 848 Views
Problem Statement. Analysis of Chemical Heat Pump Analysis of Cooling Tower Analysis of Boiler. Exit air. MOCS WORKING DIAGRAM PBL-7-98. CWR 103 F. Cooling tower. COOLING TOWER. Ambient air 85 F 80 % RH. Pump 3. WATER. Flash tank. MIXED. CWS 75 F. H2. H2 Acetone

E N D
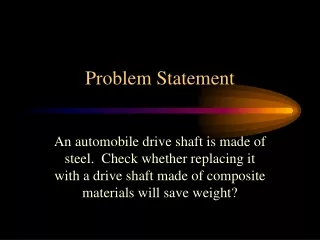
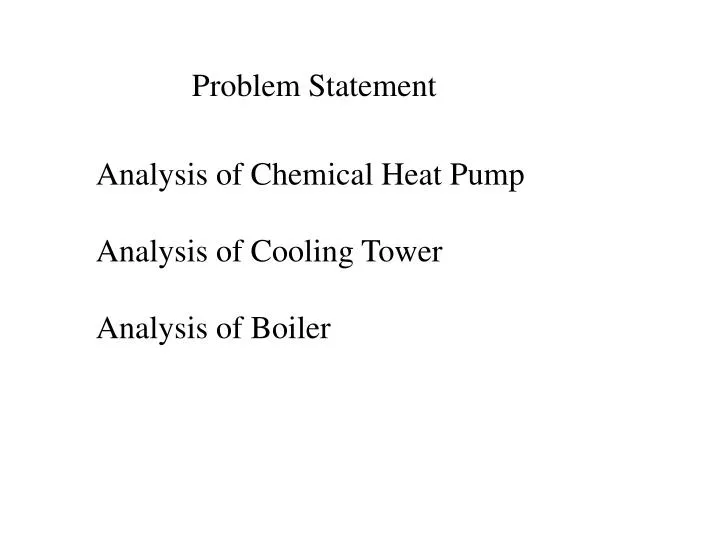
Problem Statement Analysis of Chemical Heat Pump Analysis of Cooling Tower Analysis of Boiler
Exit air MOCS WORKING DIAGRAM PBL-7-98 CWR 103 F Cooling tower COOLING TOWER Ambient air 85 F 80 % RH Pump 3 WATER Flash tank MIXED CWS 75 F H2 H2 Acetone 2-Propanol Compressor 1 condenser Pump 1 Acetone Acetone 2-prop endo reactor Distillation column Heat exchanger Hot air Cool air Exothermic reactor gas 2- prop & acetone reboiler Reduction valve H2 Pump 2 Compressor 2 water BFW Flash tank BOILER Liquid CR Combustion gasses CO2, H2O, N2, O2 T= 375 F SS Natural gas Air 79 % N2 21 % O2
Given: Chemical Heat Pump Diameter of L1 = 6.35 mm Average Velocity = 10 m/sec Temperature L6 = 200 C Mole composition of L1= .97 2-Propanol Mole composition of L5= .02 2-Propanol
Given: Chemical Heat Pump (continued) Hot Air going into Endo 23.8 C Relative Humidity 80 % Cool Air coming out of Endo 15.5 C
Required: Chemical Heat Pump Energy Supplied into Endo Reactor (Qin) Diameter of L6 Partial Pressures of L6 Amount of Water Condensed in Endo
Endo Reactor CWR L 303 Next page L 202 H2 Flash Tank 1 L 2 Acetone 2-Prop L 3 L 5 Condenser Distillation Column L 201 L 4 Q in Acetone 2- Prop L 803 Hot air Cool air Reduction valve Re-boiler L 101 L 1 Pump 2 Water L 801
Analysis: Chemical Heat Pump (Endo) Qin = 353000 Btu/ hr (29 ton unit) Water Condensed 168 lb/hr (21 gal/hr)
Exothermic Reactor Compressor 1 L 202 H2 L 203 H2 Pump 1 L 6 L 5 L 501 Acetone Acetone 2-Propanol Exo Reactor L 7 L 8 Heat Exchanger L 802 Gas L 804 H2 Compressor 2 L 801 Flash Tank 2
Analysis: Exothermic Reactor Diameter of L6 = 29.0 mm Partial Pressure: 1.96 ATM Acetone 0.04 ATM 2-Propanol
Given: Cooling Tower Cold Water Return 39.4 C Cold Water Supply 23.8 C Input Ambient Air 29.4 C Relative Humidity 80 % (Ambient Air) Exit Air 30.5 C RH 90 %
Given: Cooling Tower (continued) Diameter for CWS and CWR: 0.05 m
Cooling Tower Exit Air L 301 CWR 103 F Cooling Tower Ambient Air 85 F 80 % RH L 302 Pump 3 Water CWS 75 F L 303
Required: Cooling Tower Velocity for Cold Water Supply Velocity for Cold Water Return Pounds of Dry Air from Cooling Tower
Analysis: Cooling Tower Velocity of Cold Water Supply: 1418.0 m/hr Velocity of Cold Water Return: 1425.0 m/hr Pounds of Dry Air: 34,600 lb dry air/ hr
Given: Boiler Steam Supply 220 psig (q=1) Cold Return (q=0) Temperature of Exit Gas 190.5 C Combustion Gasses: CO2, H2O, N2, O2 Excess Air 40 %
Given: Boiler (continued) Diameter for SS and CR: .05 m
Boiler L 903 L 901 T= 375F Boiler Feed Water Boiler CR Combustion Gasses CO2,H20, N2,O2 L 902 SS Air 79 % N2 21 % O2 Natural Gas
Required: Boiler Velocity of Steam Supply Velocity of Cold Return Flow Rate of Natural Gas Percent Composition of Exit Gasses
Analysis: Boiler Velocity Steam Supply: 3960.0 m/hr Velocity Cold Return: 36.7 m/hr Amount of Natural Gas: 3.51 tons/month
Analysis: Boiler (continued) Composition of Flue Gasses: CO2 = 7.0 % H20 = 13.9 % O2 = 5.6 % N2 = 73.5 %
Differential (Batch) Distillation Bryan Gipson John Usher November 12, 1997
Progress • Familiarization with System • 2 Runs Conducted • First Run Inconsistent • Second Run Okay • Data Taken • Initial Volume: 14 liters • Time vs. Temperature • Rate of Distillation
Observations • Temperature Change • Less than Predicted • Rate of Distillation • Observed: Sporadic, ~94 ml/min • Theoretical: Decreasing, 215-200 ml/min
Next Steps • Resolve Inconsistencies • Conduct More Data Runs • Estimate Heat Losses • Compare Column Performance to Predictions
Distillation ColumnDesign Project M. O. C. Project Engineering Department Team Members Michael Hobbs Michael McGann Marc Moss Brad Parr Brian Vandagriff
Topics of Discussion • Problem Statement • Recommended Design • McCabe-Thiele Diagram • Design Specifications • Combined Flow Diagram
Topics, cont. • Method of Design • Raoult Method • van Laars Method • Sieve Tray Efficiency • Optimum Reflux Ratio • Conclusions
Problem Statement To design a new ethylene purification column to work with the advanced catalytic cracking operation that produces ethylene for manufacture of specialty products
WEST AVENUE T3 T4 FS1 EMPLOYEE PARKING PROCESS AREA C B2 T2 STREET STREET STREET T1 B1 BROADWAY SS CWS VISITOR PARKING CT1 PROCESS AREA C PROCESS AREA B 1ST 2ND 3RD CT2 COLUMN OFFICE DISTILLATE T5 T6 EAST AVENUE
Recommended Design • Design analysis included: • number of trays • tray diameter • pipe diameter for each stream • pump selection (if necessary)
McCabe-Thiele Diagram Fortran program “Distil.exe” was used to generate data that was plotted in Excel to give McCabe-Thiele Diagram. Diagram shows equilibrium line, operating line, feed line, separation line, and the stepped off stages.
Combined Flow Diagram Shows system diagram with both qualitative and quantitative information.
81 stages
Design Requirements • feed : 220 M lb/hr of vapor, 85% ethylene • product: 182 M lb/hr, 99.9% ethylene
Raoult Model • Assumes ideal behavior • System deviated slightly from ideality at low compositions
ActualData EquilibriumLine OperatingLine
van Laars Model • Assumes all non-ideal behavior in the liquid • Shows an improved correlation between model and actual data
Actual Data Equilibrium Line Operating Line
Sieve Tray Efficiency Sieve trays were chosen because they are cheaper, more efficient, and have a larger operating range than other types of tray designs