Download
1 / 13
130 likes | 131 Views
This study compares the efficacy and safety of EVG/c/FTC/TDF vs ATV/r+FTC/TDF in treatment-naïve HIV patients. The study shows non-inferior virologic response with EVG/c/FTC/TDF and lower discontinuation rates due to adverse events.

E N D
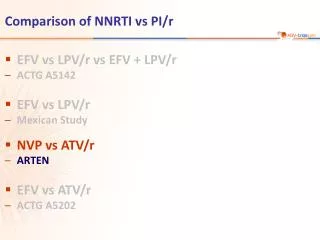
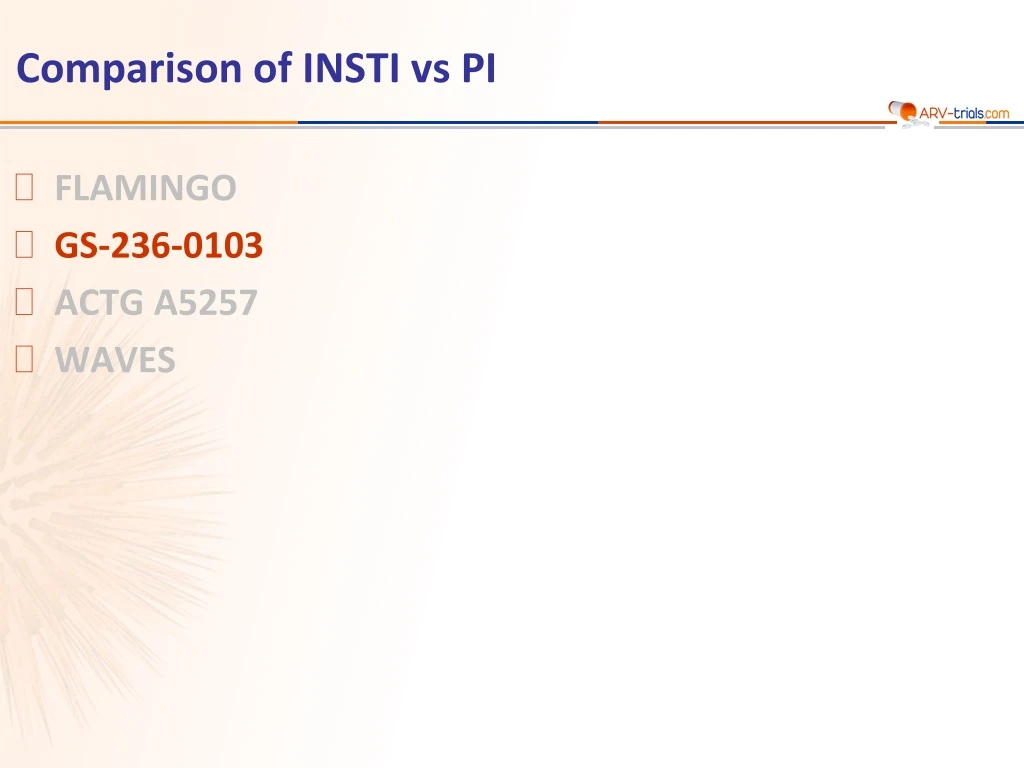
Comparison of INSTI vs PI • FLAMINGO • GS-236-0103 • ACTG A5257 • WAVES
Study GS-236-0103: EVG/c/FTC/TDF QD vs ATV/r + FTC/TDF QD • Design Randomisation* 1 : 1 Double-blind W48 W192 N = 353 > 18 years ARV-naïve HIV RNA > 5,000 c/mL Any CD4 cell count eGFR> 70 mL/min N = 355 *Randomisation was stratified by HIV RNA (< or > 100,000 c/mL) at screening • Objective • Non inferiority of EVG/c/FTC/TDF at W48: % HIV RNA < 50 c/mL by intentionto treat, snapshot analysis (lower margin of the 2-sided 95% CI for the difference = -12%, 95% power) DeJesus E. Lancet 2012;379:2429-38 GS-236-0103
Study GS-236-0103: EVG/c/FTC/TDF QD vs ATV/r + FTC/TDF QD Baseline characteristics and patient disposition DeJesus E. Lancet 2012;379:2429-38 ; Rockstroh JK, JAIDS 2013;62:483-6 GS-236-0103
Study GS-236-0103: EVG/c/FTC/TDF QD vs ATV/r + FTC/TDF QD Response to treatment at week 48 HIV RNA < 50 c/mL EVG/c/FTC/TDF Primaryanalysis % ATV/r + FTC/TDF 97.7 97.5 100 89.5 86.8 Viral suppression was high in both treatment arms, for various subgroups including patientswith HIV RNA > 100 000 c/mLat baseline 75 50 Mean CD4/mm3 increase at W48 : + 207 (EVG/c/FTC/TDF) vs + 211 (ATV/r + FTC/TDF) 25 0 ITT, snapshot Per protocol Adjusted difference (95% CI)= 3.0 % (- 1.9; 7.8) Adjusted difference (95% CI)= = -0.1 % (- 2.6; 2.4) DeJesus E. Lancet 2012;379:2429-38 GS-236-0103
Study GS-236-0103: EVG/c/FTC/TDF QD vs ATV/r + FTC/TDF QD ARN VIH < 50 c/ml % 100 80 60 EVG/c/FTC/TDF 40 ATV/r + FTC/TDF 20 0 0 2 4 8 12 16 20 24 28 32 36 40 40 48 Weeks Number of patients EVCG/c/FTC/TDF 353 353 353 353 353 353 353 353 353 ATV/r + FTC/TDF 355 355 355 355 355 355 355 355 355 DeJesus E. Lancet 2012;379:2429-38 GS-236-0103
Study GS-236-0103: EVG/c/FTC/TDF QD vs ATV/r + FTC/TDF QD Response to treatment at week 96 and week 144 HIV RNA < 50 c/mL at week 96 HIV RNA < 50 c/mL at week 144 EVG/c/FTC/TDF EVG/c/FTC/TDF % % ATV/r + FTC/TDF ATV/r + FTC/TDF 100 100 86.7 85.4 83.3 82.3 81.0 78.9 77.6 74.6 75 75 50 50 25 25 0 0 ITT, snapshot ITT, M = F ITT, snapshot ITT, M = F Adjusted difference (95% CI)= 3.1 % (- 3.2; 9.4) Adjusted difference (95% CI)= 2.3 % (- 3.6 ; 8.2) Adjusted difference (95% CI)= 1.1 % (- 4.5 ; 6.7) Adjusted difference (95% CI)= 1.4 % (- 3.8 ; 6.5) Rockstroh JK, JAIDS 2013;62:483-6 ; Clumeck N, JAIDS 2014;65:e121-4 GS-236-0103
Study GS-236-0103: EVG/c/FTC/TDF QD vs ATV/r + FTC/TDF QD Response to treatment at week 144 Secondary outcomes No treatment difference in virologic success for various subgroups, including patients with HIV RNA > 100,000 c/mL at baseline, except for adherence > 95 % (favoring EVG/c/FTC/TDF) Mean decrease in bone mineral density * p = 0.018 DeJesus E. Lancet 2012;379:2429-38 ; Rockstroh JK, JAIDS 2013;62:483-6 ; Clumeck N, JAIDS 2014;65:e121-4 GS-236-0103
Study GS-236-0103: EVG/c/FTC/TDF QD vs ATV/r + FTC/TDF QD • Virologic failure definition • Suboptimal virologic response : 2 consecutive visits with HIV RNA ≥ 50 c/mLand <1 log10 c/mL below baseline at or after week 8 • Virologic rebound (2 consecutive visits with HIV RNA either ≥ 400 c/mL after achieving HIV RNA < 50 c/mL, or >1 log10 c/mL increase from nadir) • HIV RNA ≥ 400 c/mL at their last visit (at or after week 8) • Criteria for resistance testing • Virological failure or HIV RNA > 400 c/mL at study discontinuation(at or after W8 and taking study drug) Resistance data at week 48 * Q148R, N = 2, N155H, N = 1, T66I + E92Q + N155H, N = 1 ; ** 1 had also M184V + K65R and 2 M184V DeJesus E. Lancet 2012;379:2429-38 GS-236-0103
Study GS-236-0103: EVG/c/FTC/TDF QD vs ATV/r + FTC/TDF QD Resistance data at week 144 * INSTI + NRTI resistance, N = 3, ** INSTI + NRTI resistance, N = 1 Rockstroh JK, JAIDS 2013 62:483-6 ; Clumeck N, JAIDS 2014;65:e121-4 GS-236-0103
Study GS-236-0103: EVG/c/FTC/TDF QD vs ATV/r + FTC/TDF QD • Treatment-emergent adverse events leading to premature discontinuation of study drugs DeJesus E. Lancet 2012;379:2429-38 ; Rockstroh JK, JAIDS 2013;62:483-6 ; Clumeck N, JAIDS 2014;65:e121-4 GS-236-0103
Treatment-emergent adverse events occurring in > 10% of patients in either group (week 48) Study GS-236-0103: EVG/c/FTC/TDF QD vs ATV/r + FTC/TDF QD • Laboratory test results at week 48 DeJesus E. Lancet 2012;379:2429-38 GS-236-0103
Study GS-236-0103: EVG/c/FTC/TDF QD vs ATV/r + FTC/TDF QD Median change in serum creatinine (mmol/L) concentration from baseline 20 15 10 5 0 ATV/r + FTC/TDF EVG/c/FTC/TDF -5 -10 Weeks 0 2 4 8 12 16 24 32 40 48 Discontinuations due to renal event DeJesus E. Lancet 2012;379:2429-38 ; Rockstroh JK, JAIDS 2013; 62:483-6 ; Clumeck N, JAIDS 2014;65:e121-4 GS-236-0103
Summary (W48 results) EVG/c/FTC/TDFQD was virologically non inferior to ATV/r + FTC/TDF Similar virologic reponse of the 2 regimens in different subgroups of patients, including those with high HIV RNA at enrolment Discontinuation because of adverse events was lower with EVG/c/FTC/TDF : 3.7% vs 5.1% Development of major resistance mutations occurred in 5 patients on EVG/c/FTC/TDF : 4 with integrase mutations (3/4 had also NRTI mutations), 1 with only RT mutation (M184V) none on ATV/r + FTC/TDF Incidence of adverse events was similar except for jaundice/icterus Median increases in creatinine with accompanying decreases in estimated glomerular filtration rate occurred in both study groups by week 2 generally stabilized by week 8 and did not change up to week 48 median change : + 11 μmol/L vs + 7 μmol/L ; P < 0.001 Study GS-236-0103: EVG/c/FTC/TDF QD vs ATV/r + FTC/TDF QD DeJesus E. Lancet 2012;379:2429-38 GS-236-0103