Download
1 / 9
90 likes | 218 Views
Electron probe microanalysis EPMA. Thin Film Analysis. What’s the point?. EPMA is traditionally done for bulk material. What are the issues for thin films? How precise/accurate are such analyses?. Bulk vs thin film.

E N D
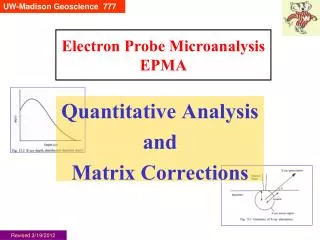
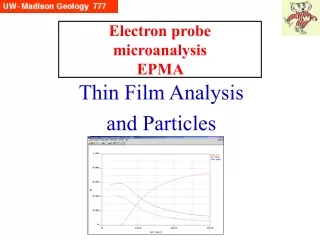
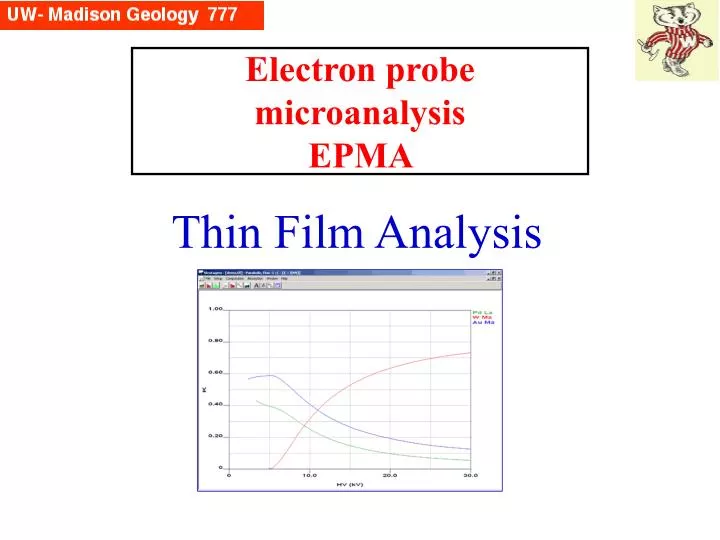
Electron probe microanalysisEPMA Thin Film Analysis
What’s the point? EPMA is traditionally done for bulk material. What are the issues for thin films? How precise/accurate are such analyses?
Bulk vs thin film Normal EPMA assumes that the electron beam is exciting a homogeneous volume, i.e. there is no difference either laterally or vertically. Thus, the matrix correction is being applied in a uniform matter, and there is one applicable f(rz) profile for each element . As research has improved the accuracy of the f(rz) profiles, it is now possible to take thin films (including multiple films) and apply f(rz) models and calculate best fits for unknown parameters. For example, if you know that there is a TiO2 skin atop your Ti metal, you can acquire Ti and O X-ray counts at several E0 values, and then try to match them by modeling various film thicknesses with 3rd party software programs. Or if you have been able to measure a film thickness, you could use EPMA to determine what the phase stoichometry is.
It can be helpful to run Monte Carlo simulations of thin films. Here, the new Casino software is used to model 15 keV electrons hitting a 1 mm layer of TiO2 on Ti. Red trajectories to top left are BSEs. At bottom left is a model of the O Ka f(rz) profile (blue), plus the profile of X-rays predicted to escape (red) and get to the detector. MC Simulation: TiO2 on Ti Here the range of various energy incident electrons are modeled.
Thin films can be studied with the electron microprobe, although the acquired data cannot be run through (matrix corrected by) the normal probe software — which only works for homogeneous volumes. How it’s done: With the probe, acquire x-ray intensities on both standards and unknown at various accelerating voltages (minimally 3, preferably more; e.g. 5, 10, 15 keV). K-ratios are then calculated, and then plotted up against the accelerating voltage. Then the thin film program — here the costly STRATAGem (~$6K)— is run either in forward or inverse mode. In forward mode, a film composition and thickness (and substrate) are input, and the program then uses the physical mode (phi-rho-Z) to determine what the k-ratios Thin Film Software-1 should be at various voltages, and you then try to match your experimental data for the best fit. In reverse mode, you input all your experimental data and the program tries to come up with a best fit solution. STRATAGem also (importantly) takes secondary fluorescence into account.
Thin Film Software-2 Another option (cheaper) the freeware GMRFilm (written by R.Waldo of the GM epma lab). STRATA-Gem is very slick and has a Windows interface, whereas GMRFilm runs under DOS and requires manual tabulating. In this example,we are trying to determine the effect of a 0.1 mm oxide coat (TIO2) on the surface of Ti metal. The program proceeds in steps: it first calculates the effective x-ray intensity (K-ratio) coming from the top layer (layer 1): it shows that there will Ti Ka x-ray intensity (as a K-ratio) of 0.073 (we’ll ignore the Oxygen). And then it estimates that the substrate will yield a Ti K-ratio of 0.864. So how do we compare the probe data with this? The probe only measures TOTAL Ti x-rays, so we need to ADD together the 2 Ti K-ratios, which yields 0.937. This says then that this oxide film on top of Ti ‘robs’ the metal of ~6% of the Ti Ka counts it should yield. GMRFilm also takes secondary fluorescence into account.
We have previously introduced the CASINO Monte Carlo simulation software. Besides showing the trajectories of electrons, CASINO also calculates f(rz) curves — x-ray generation and emission versus depth. These are quantitative, and the intensities are integrated and numerical values are shown next to each colored symbol: you want to look at the RED curve, confusingly marked “absorbed intensity”, which is really the emitted x-ray intensity, and the blue is what is absorbed by the matrix. There is a value shown: you can use this as the x-ray intensity of the unknown sample (thin film on a substrate). Thin Film Software-3 One more step must be done: you need to set up a simulation on material that will act as the standard: it could be anything, it could be the same material you really used as a standard for EPMA. Say you are looking at TiO2, it makes sense to use a bulk simulation of TiO2. And treat this the same way as STRATAGem or GMRFilm.
Oxygen on Boron metal (2 standards) This and the next slide demonstrate the utility of thin film software. We needed to verify that our boron standard was pure, but there was a small peak at O ka. I ran it at 2, 3, 7 & 15 keV (red and black symbols), and then tested various interpretations of the data. Oxygen as bulk did not fit, whereas a 12Å oxide film did. Experiment Models Not bulk, but ~12 Å film B2O3 (2 different Boron standards) Thin film modeled with GMRfilm
Carbon on Boron metal Not bulk, but ~12-18 Å C film (2 different Boron standards) Thin film modeled with GMRfilm