Download
1 / 43
430 likes | 1.03k Views
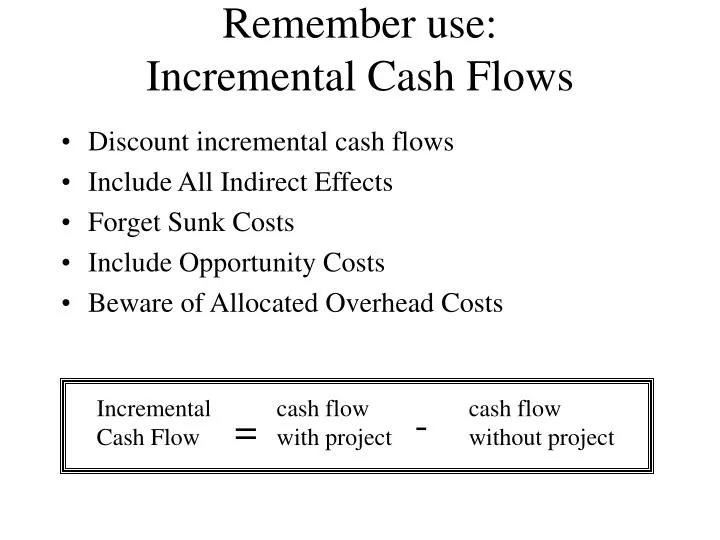
Incremental Cash Flow. cash flow with project. cash flow without project. -. =. Remember use: Incremental Cash Flows. Discount incremental cash flows Include All Indirect Effects Forget Sunk Costs Include Opportunity Costs Beware of Allocated Overhead Costs. Sequence of Firm Decisions.

E N D
Incremental Cash Flow cash flow with project cash flow without project - = Remember use: Incremental Cash Flows • Discount incremental cash flows • Include All Indirect Effects • Forget Sunk Costs • Include Opportunity Costs • Beware of Allocated Overhead Costs
Sequence of Firm Decisions • Capital Budget - The list of planned investment projects. • The Decision Process • 1 - Develop and rank all investment projects • 2 - Authorize projects based on: • Govt regulation • Production efficiency • Capacity requirements • NPV (most important)
Capital Budgeting Process • Capital Budgeting Problems • Consistent forecasts • Conflict of interest • Forecast bias • Selection criteria (NPV and others)
How To Handle Uncertainty Sensitivity Analysis - Analysis of the effects of changes in sales, costs, etc. on a project. Scenario Analysis - Project analysis given a particular combination of assumptions. Simulation Analysis - Estimation of the probabilities of different possible outcomes. Break Even Analysis - Analysis of the level of sales (or other variable) at which the company breaks even.
Sensitivity Analysis Example Given the expected cash flow forecasts listed on the next slide, determine the NPV of the project given changes in the cash flow components using an 8% cost of capital. Assume that all variables remain constant, except the one you are changing.
Sensitivity Analysis Example - continued NPV= $478
Sensitivity Analysis Example - continued Possible Outcomes
Sensitivity Analysis Example - continued NPV Calculations for Pessimistic Investment Scenario NPV= ($121)
Sensitivity Analysis Example - continued NPV Possibilities
Break Even Analysis Example Given the forecasted data on the next slide, determine the number of planes that the company must produce in order to break even, on an NPV basis. The company’s cost of capital is 10%.
Break Even Analysis Answer The break even point, is the # of Planes Sold that generates a NPV=$0. The present value annuity factor of a 6 year cash flow at 10% is 4.355 Thus,
Break Even Analysis Answer Solving for “Planes Sold”
Flexibility & Options • Decision Trees - Diagram of sequential decisions and possible outcomes. • Decision trees help companies determine their Options by showing the various choices and outcomes. • The Option to avoid a loss or produce extra profit has value. • The ability to create an Option thus has value that can be bought or sold.
Decision Trees Success Test (Invest $200,000) Pursue project NPV=$2million Failure Stop project NPV=0 Don’t test NPV=0
Decision Tree: Example • You invest in a dot com company. • At the start of each year for 3 years, it requires £1 million to continue. • The future value of a successful dot.com in at the beginning of the 4th year is £10 million. • Each year it has a 50% of surviving. • What is the NPV of this investment at r=.1?
You want to be a millionaire • You have no life-lines and are risk neutral. For simplicity assume if you answer wrong you get £0. • If your are at £500,000, at what certainty would you guess for the million? • Given your previous answer. Before seeing the question your certainty of answering correctly the £500,000 is either 25% or 75% with equal chance. • At what certainty at £250,000, would you go for it?
Risk • Rates of Return • 73 Years of Capital Market History • Measuring Risk • Risk & Diversification • Thinking About Risk
The value of a $1 investment in 19266 Index Year End Source: Ibbotson Associates
Rates of Return Percentage Return Year • Source: Ibbotson Associates
Equity Premium Puzzle. • In 1985, a pair of economists, Rajnish Mehra and Edward Prescott, examined almost a century of returns for American shares and bonds. After adjusting for inflation, equities had made average real returns of around 7 a year, compared with only 1% for Treasury bonds-a 6% point equity premium. Given that shares are riskier (in the sense that their prices bounce around more) there should have been some premium. But theory suggested it should not have been much more than 1 point. The extra five points seemed redundant--evidence of some inexplicable market inefficiency
Measuring Risk Variance - Average value of squared deviations from mean. A measure of volatility. Standard Deviation – Square-Root of Variance. A measure of volatility.
Measuring Risk Coin Toss Game-calculating variance and standard deviation
Risk and Diversification Diversification - Strategy designed to reduce risk by spreading the portfolio across many investments. Unique Risk - Risk factors affecting only that firm. Also called “diversifiable risk.” Market Risk - Economy-wide sources of risk that affect the overall stock market. Also called “systematic risk.”
Risk and Diversification What does this tell you about mutual funds (unit trusts)?
Topics Covered • Measuring Beta • Portfolio Betas • CAPM and Expected Return • Security Market Line • Capital Budgeting and Project Risk
Measuring Market Risk Market Portfolio - Portfolio of all assets in the economy. In practice a broad stock market index, such as the S&P Composite, is used to represent the market. Beta - Sensitivity of a stock’s return to the return on the market portfolio.
Measuring Market Risk Example - Turbo Charged Seafood has the following % returns on its stock, relative to the listed changes in the % return on the market portfolio. The beta of Turbo Charged Seafood can be derived from this information.
Measuring Market Risk Example - continued
Measuring Market Risk Example - continued • When the market was up 1%, Turbo average % change was +0.8% • When the market was down 1%, Turbo average % change was -0.8% • The average change of 1.6 % (-0.8 to 0.8) divided by the 2% (-1.0 to 1.0) change in the market produces a beta of 0.8. • Beta is a measure of risk with respect to the market (covariance). Can be additional risk! • Betting on Israel vs. Austria WC game.
Measuring Market Risk Example - continued
Portfolio Betas • Diversification decreases variability from unique risk, but not from market risk. • The beta of your portfolio will be an average of the betas of the securities in the portfolio. • If you owned all of the S&P Composite Index stocks, you would have an average beta of 1.0
Measuring Market Risk Market Risk Premium - Risk premium of market portfolio. Difference between market return and return on risk-free Treasury bills.
Measuring Market Risk Market Risk Premium - Risk premium of market portfolio. Difference between market return and return on risk-free Treasury bills. Market Portfolio
Measuring Market Risk CAPM - Theory of the relationship between risk and return which states that the expected risk premium on any security equals its beta times the market risk premium.
Measuring Market Risk Security Market Line - The graphic representation of the CAPM.
Problems with CAPM • Plotting average return vs. Beta, a zero Beta beats Risk-free rate. • Short term doesn’t do so well. • Unstable Betas. • Tough to test. Will the real market portfolio stand up? • Beta is not a very good predictor of future returns. However, Jagannathan & Wang do find support with adjustments.
Capital Budgeting & Project Risk • The project cost of capital depends on the use to which the capital is being put. Therefore, it depends on the risk of the project and not the risk of the company.
Capital Budgeting & Project Risk Example - Based on the CAPM, ABC Company has a cost of capital of 17%. (4 + 1.3(10)). A breakdown of the company’s investment projects is listed below. When evaluating a new dog food production investment, which cost of capital should be used? 1/3 Nuclear Parts Mfr.. B=2.0 1/3 Computer Hard Drive Mfr.. B=1.3 1/3 Dog Food Production B=0.6
Capital Budgeting & Project Risk Example - Based on the CAPM, ABC Company has a cost of capital of 17%. (4 + 1.3(10)). A breakdown of the company’s investment projects is listed below. When evaluating a new dog food production investment, which cost of capital should be used? R = 4 + 0.6 (14 - 4 ) = 10% 10% reflects the opportunity cost of capital on an investment given the unique risk of the project. You should use this value in computing that project’s NPV!!
Wait a second! • A project has a NPV=£10,000 when r=.05 and a NPV=-£10,000 when r=.1 and the company can borrow at 5%. Why shouldn’t the company invest even if the cost of capital is 10% because of a beta? • Shouldn’t a project that is risky but has Beta=0 be considered worse than a project that is safe and has Beta=0?