Download
1 / 106
1.1k likes | 1.29k Views
Introduction to Logic. PAMI-W-0001-02 . Introduce the user to the Logic data analytics software, it’s role in the FlexNet system, the features and functions of Logic and the key elements of the user interface. The goal for this module is to:. Module Goal. Role of Logic in FlexNet System

E N D
Introduction to Logic PAMI-W-0001-02
Introduce the user to the Logic data analytics software, it’s role in the FlexNet system, the features and functions of Logic and the key elements of the user interface. The goal for this module is to: ModuleGoal
Role of Logic in FlexNet System • Logic Feature Overview • Logic User Interface Overview • Logic Dashboards • Using Logic
The Role of Logic in the FlexNet System Section One
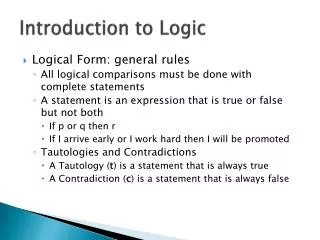
Identify the role of Logic in the FlexNet system. • Describe the purpose of a meter data management (MDM) system. • Define the different data types collected in Logic. • Explain the method used by Logic to process meter data. Section One Objectives
The FlexNet System and Logic The Role of Logic in the FlexNet System • Advanced Metering Infrastructure (AMI) system • Reads water, gas and electric meters and supports • One- and Two-way RF transmission (water and gas) • Two-way RF transmission (electric) • Consists of three components • Meters w/SmartPoint Modules (endpoints) • FlexNet Base Station (Antenna/Transceiver) • Regional Network Interface (RNI) - servers, database, software, FlexWare • Role of Logic • Data analytics software • Tracks, stores, validates and manages the data • Web-based user interface
Data Flow The Role of Logic in the FlexNet System FlexNet System Meters with SmartPoint modules (endpoints) Base Station Regional Network Interface(RNI) Servers, Software, & Databases — Oracle or SQL— FlexWare WirelessRF Solid-state Digital AMI Meters Antenna / Transceiver — Gas — Water — Electric Logic Software
Meter Data Management Overview • Key component of network infrastructure • Imports and processes data • Performs long term data storage • Manages large amounts of data (Smart Grid) • Logic is data analytics software that goes beyond the core features of an MDM to include a • Billing interface to validate and export billing information • Data reporting, tracking and analysis • Customized user roles and menus • Highly configurable interface • The Role of Logic in the FlexNet System
Data Collection Process The Role of Logic in the FlexNet System • Meter Read Data is collected, validated and stored in preparation for billing, tracking and analysis • Logic was designed to handle this immense volume of meter, interval and operational data
Three Data Types Collected in Logic The Role of Logic in the FlexNet System
Register Read vs. Interval Read The Role of Logic in the FlexNet System Register Reads (24 hour period) 400 GAL Interval Reads (4 Hour Intervals) 75 30 20 50 = 400 2012/06/01 08:00:00 2012/06/01 00:00:00 2012/06/02 00:00:00 2012/06/01 20:00:00 2012/06/1616:00:00 2012/06/01 04:00:00 gal
Validation, Estimation and Editing (VEE) Process The Role of Logic in the FlexNet System • Failed • Outside acceptable range • Estimate, Edit or Accept
Which of the following best describes the role of Logic in the FlexNet system? • Logic manages the entire FlexNet system • Logic is the data analytics software • Logic is the software controlling the antennas • Logic is a network server that stores meter data
True or False? A meter data management system performs long term data storage and management for large amounts of data. True
Match the term on the left with the definition on the right. • Interval Read • Register Read • Meter Event b • __ Actual meter value • __ Irregular meter occurrence • __ Usage between two points of time c a
What is the flow of data through the VEE process? • Data Load > Estimating & Editing > Validation > Processed • Estimation & Editing > Data Load > Validation > Processed • Validation > Estimation & Editing > Data Load > Processed • Data Load > Validation > Estimation & Editing > Processed
Logic Features Overview Section Two
List the five key features of Logic. • Identify which system features are configurable in Logic. • Recognize the function of My Menu. • Name two reports used in data analysis. • Following this section, you should be able to: Section Two Objectives
Five Key Features of Logic Logic Features Overview
Key Feature: Monitoring Meter Health and Performance Logic Features Overview • Valuable tool for monitoring meters • View real time meter status • Historical meter usage • Critical information in responding to leaks • Aids in optimizing performance • Reporting • Information (data) tracking and analysis
Reporting Categories Logic Features Overview • Meter Exceptions – meters missing reads or reporting irregular consumption values • Meter Reads – meter read status (pass/fail) • Meter Events – any meter events • Communication – non-communicating meters • Conservation – water meters reporting exceptional consumption values • Billing – rate plan comparison
Reporting: Maps View Logic Features Overview • Interactive map view displays meters and collectors (base stations) geographically • Display • Current meter status • Communication issues
Key Feature: Validating and Exporting Billing Logic Features Overview
Key Feature: Performing System Configuration Logic Features Overview Logic
Key Feature: Analyzing Meter Data Logic Features Overview • Numerous reports for data analysis • Analysis assists utility companies in: • Forecasting and planning • Calculating and reducing loss • Evaluating rate plans • Identifying violators
Commonly Used Reports Logic Features Overview • Meters Missing Register Reads • High Water Usage (Conservation) • Continuous Consumption (Leaks) • Rate Impact Analysis
Key Feature: Customizing the User Interface Logic Features Overview • Variety of Roles • Basic • Billing • Customer Service • Operators • Administrators • My Menu • Custom Menu for the user • Select the default screen • Add, Update or Delete Menu Items • Task Manager • Create, Assign, Prioritize, Schedule and Track manual tasks Logic
True or False? One of the key features of Logic is the validation and export of billing information. True Other features include monitor the health and performance of meters, perform Logic configuration, analyze meter data and customize the user interface
Which of the following are examples of configurable system features in Logic? • Menus • Roles and Users • Tasks • All of the above
What would you consider the most valuable feature of Logic and why? Possible answers: Monitor the health and performance of meters Validate and export billing information Perform Logic configuration Analyze meter data Customize user interface
Each user has the ability to add, update or delete menu items using: • Task Manager • Rules Engine • Reports • My Menu
Logic has numerous reports for use in data analysis. Name two of the more commonly used reports. Possible answers: Meters Missing Register Reads Rate Impact Analysis High Water Usage Continuous Consumption Report
Logic User Interface Overview Section Three
Log in to Logic. • Identify the components of the main screen. • Log out of Logic. Section Three Objectives
Logging in to Logic Logic User Interface Overview • Open Internet Explorer • Enter the IP address of the Logic server web interface • Enter the Username and Password • Click Login
Introducing the Logic Main Screen Logic User Interface Overview Navigation Pane Content Pane
Describing the Navigation Pane Logic User Interface Overview • 1 - User Information • Sensus Logo • Username • Logout link 1 • 2 - Meter History • Drop-down list for previously viewed meters 2 3 • 3 - Menu Operation Icons • Provides a quick way to find and navigate to any menu • Add menu items to a custom My Menu option 4 • 4 - Menu Area • Three levels of hierarchy • Menus (green background) • Sub-menus (white background) • Menu items (white text)
Describing the Default Content Pane: Dashboard Logic User Interface Overview • 2 – Register Reads • Pie chart • Successful vs. Failed reads 2 • 1 – Meter Event Summary • Table of events • Type, # Meters, # Events 1 • 3 – Maps • Displays meters, collectors, statuses • Interactive 3
Logging out of Logic Logic User Interface Overview • Click the Logout link in the Context Area
True or False? Logic is accessed through Internet Explorer. True Logic is a web-based user interface best accessed through Internet Explorer 6.0 or higher
The navigation pane is used to access — • Menus • Logout • Meter history • All of the above
What area of the navigation pane contains three levels of hierarchy that expand and collapse? • Context Area • Menu Area • Map Area • Meter Event Summary
What is the default display in the Content Pane containing the meter event summary, register reads and maps reports in an arrangement of panels? • Navigation Pane • Context Area • Menu • Dashboard
Logic Dashboards Section Four
List and define the three report areas of the Logic dashboards. • Explain how to view the details for a meter event using the meter event summary report area of the dashboard. • Explain how to identify the number of meters passing validation and the number of meters missing reads using the register reads report area of the dashboard. • Identify the components of the Map area of the dashboard. Section Four Objectives
Viewing Logic Dashboards Logic Dashboards • Work as the control panel for the user • Divided into three report areas • Meter Event Summary • Register Reads • Map • Each report area can be drilled down to the detail level • Accessed in Reports > Dashboards • Display in the content pane of the window • Dashboards are specific to the utility type The dashboard(s) that display in the Logic menu are dependent on the user login
Describing Water Dashboard Components Logic Dashboards Meter Event Summary Register Reads Map