Download
1 / 31
310 likes | 392 Views
Weighted synergy graphs for effective team formation with heterogeneous ad hoc agents. Somchaya Liemhetcharat , Manuela Veloso Presented by: Raymond Mead. Problem. Written for RoboCup Rescue Simulator, where teams of robots are used to solve tasks.

E N D
Weighted synergy graphs for effective team formation withheterogeneous ad hoc agents SomchayaLiemhetcharat, Manuela Veloso Presented by: Raymond Mead
Problem • Written for RoboCup Rescue Simulator, where teams of robots are used to solve tasks. • We want to choose the best team of robots to tackle a disaster. • Around 50 possible agents. • How can we form the best team when everyone’s abilities, and how well people work together, are known? • Given observations of groups and their performances, how can we generate a graph to model each person’s ability, and how well people work together?
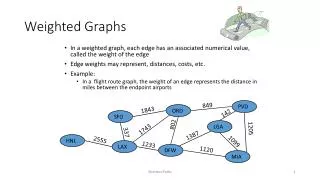
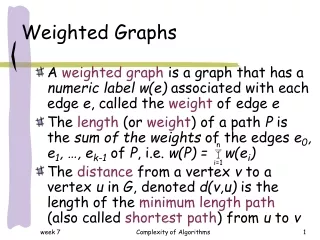
Modeling Teams • For forming teams, we want to look at: • The compatibility between members of the team. • Each person’s ability. • Using a weighted graph: • Each vertex represents a person, who has a certain ability • Edges are used to show similarity between people • A person’s ability is modeled as a normal distribution • For someone, , their ability is
Compatibility • is the minimum distance between • , is a compatibility function. • Models how well people work together. • Larger distance → Less compatible • , exponential decay
Synergy of a Pair • A pair of people: • For a pair’s Synergy, add their abilities, , and scale it by how compatible they are, . • Normal distribution ~
Synergy of a Team • Average the Synergy between all pairs in a team • Normal Distribution ~
Evaluating a Team • -value of a team is s.t. . • Probability of a team’s performance being is . • If , then • high risk, high reward • low risk, low reward • is better than if • -optimal team: • Has largest
Problem: Finding the -Optimal Team • Among all possible teams, find the best team for given . • Need to check all possible sizes of teams • Need to check most, if not all teams for each team size. • NP-Hard • Reduce the Max-Clique problem to Finding the Optimal Team. • Max-Clique: Find the largest subgraph, where there is an edge between every pair of vertices. • NP-Complete
Algorithm: -optimal team of size • Branch and Bound Algorithm: • is a team used for exploring possible teams. • Bound performance of to decide to keep exploring or not. • is the current known best team, with . • Initially, , and . • Check all pairs, unless a new best is not possible with the current members. • if the best is known • otherwise
Algorithm: -optimal team of size If , compare and Return if is better, otherwise. For , where • All nodes that can be added are assumed to be worst or best case • Min compatibility with min ability → worst • Max compatibility with max ability → best
Reducing the Max-Clique Problem • , is unweighted - want to find the max-clique. • The max-clique in will be the largest optimal team. • Create to run with • Each edge in corresponds to an edge of weight 1 in • Everyone’s ability is • , Evaluating a team only depends on mean, always 1.
Max-Clique → Best Team • Evaluating : , definition , only mean matters • only when there is an edge between a pair in • otherwise • Maximized when there is an edge between every pair of
Approximation Algorithm • Simulated Annealing • Looking at teams similar to the current best, and comparing them • Generate a random team • Repeat constant times: • Find a new team similar to the current best, swap a node in • Evaluate both teams • Replace if the new team is better • Return the best team found • Runs in if is known. • Evaluating is , where • if n is unknown
Approximation Algorithm Repeat times Compare and Replace if is better Return
Comparison • Effectiveness of team is • Where ’s performance fits between best and worst.
Learning the Synergy Graph • We have observations, , containing all people, . • Each observation is , team , performance, . • Find a synergy graph that best fits the observations. • Need to find ability of each person. • Need to find the compatibility between people. • Strategy: Simulated Annealing
Learning Algorithm : Repeat constant times: Compare scores of , and if is better Return
Generating G and Finding Similar G’ • Vertices represent each person • Randomly put edges of random weights between vertices • Do one of the following to : • Increase a random edge’s weight by 1 • Decrease a random edge’s weight by 1 • Remove a random edge • Add a random edge of random weight
Fitting Abilities to a Graph • Look at all teams of size 2 or 3 of , . • Each , there are observations of , each with a performance. • Fit a normal distribution to the observed performance of . • , is the observed distribution of • is the set of all • We want the distribution of to match the distribution of . • Fit to as best we canchoosing for each person
Fitting Abilities • For with of size 2: • Similar for of size 3. • Know , from the graph, and we want to fit to. • , matrix of , one row per team, • Fit , for • matrix of , one row per team, • Fit for
Log-Likelihood • Sum of log-likelihoods for each observation, given synergy graph, and abilities. • For an observation : • Probability density of normal distribution at value .
Evaluation • Generate a hidden graph, with compatibility and abilities. • Generate a set of observations • Run the learning Algorithm • Compare Log-Likelihood of learned graph with true graph.
Thoughts: • Domain specific: • Works well for the given problem, but may not be good for other applications. • Tested for relatively small graphs. • May not be generalizable to large sparse graphs. • Due to randomness of search. • Modifying for learning large graphs: • Generate a better initial graph. • Make better choice for a similar graph. • More localized evaluation.