Download
1 / 32
320 likes | 450 Views
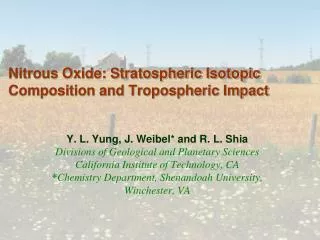
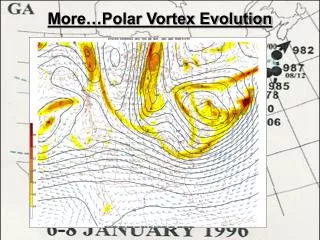
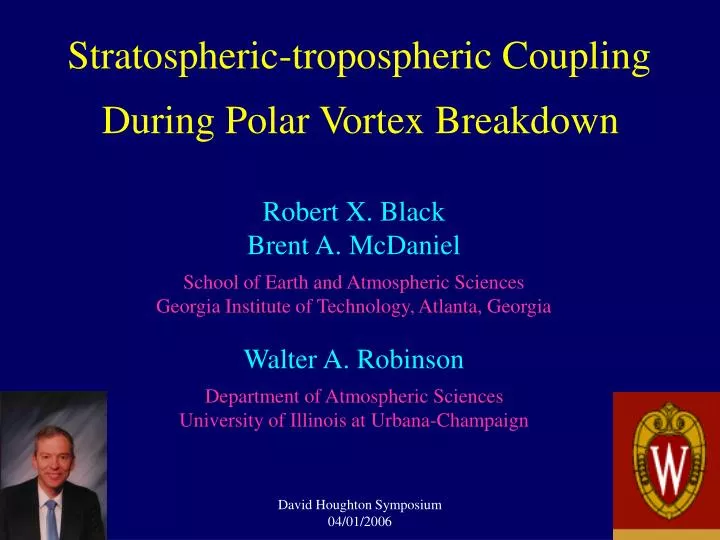
Stratospheric-tropospheric Coupling During Polar Vortex Breakdown. Robert X. Black Brent A. McDaniel School of Earth and Atmospheric Sciences Georgia Institute of Technology, Atlanta, Georgia Walter A. Robinson Department of Atmospheric Sciences University of Illinois at Urbana-Champaign.

E N D
Stratospheric-tropospheric CouplingDuring Polar Vortex Breakdown Robert X. Black Brent A. McDaniel School of Earth and Atmospheric Sciences Georgia Institute of Technology, Atlanta, Georgia Walter A. Robinson Department of Atmospheric Sciences University of Illinois at Urbana-Champaign David Houghton Symposium 04/01/2006
Zonal average east-west winds (U) for January Winter Hemisphere Circulation Summer Hemisphere Circulation Stratospheric Polar Vortex Stratosphere Tropospheric Jet Stream Troposphere [Yang & Schlesinger, 1998]
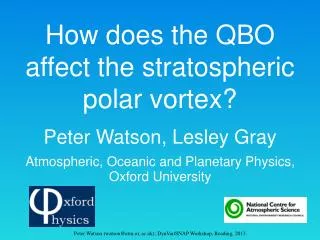
Background & Motivation • Intraseasonal variations in the wintertime stratospheric polar vortex linked to near surface variability (AO/NAO) via the Northern Annular Mode (Thompson and Wallace 1998) • Mid-winter Sudden Stratospheric Warming events linked to intraseasonal NAM variability (in troposphere & stratosphere) (Taguchi 2003; Limpasuvan et al. 2004) • Annual cycle of stratospheric polar vortex exhibits relatively rapid breakdown (stratospheric final warming -> SFW) • However, considerable interannual variability in timing of stratospheric final warming events (Waugh et al. 1999) David Houghton Symposium 04/01/2006
Scientific Questions • Do interannual variations in the timing of stratospheric final warming events provide a coherent net impact upon the tropospheric circulation in comparison to climatology? • If so, to what extent does this behavior resemble the canonical intraseasonal NAM behavior? David Houghton Symposium 04/01/2006
Approach/Methodology/Data • Identify annual SFW events based on observed evolution in longitudinally-averaged east-west wind @ 70N (10;50 hPa) • Assess 3-D circulation (anomalies [deviations from annual cycle/seasonal trend values]) for each day within a time window centered on SFW event • Composite together 47 annual (anomaly) evolutions • Events identified independently in NCEP/NCAR, ERA-40, and Free University Berlin observational datasets • Primary dataset for composite analysis: National Centers for Environmental Prediction/Nation Center for Atmospheric Research reanalysis project (Version 1) for 1958-2004 David Houghton Symposium 04/01/2006
Contrast SFW Composite [u] with Seasonal Trend Substantial local sharpening of [u] tendency field Anomalous [u] both prior to and after SFW onset Question: To what extent does this trend sharpening extend down to troposphere?
Composite Circulation Evolution: Zonal-mean Zonal Wind @ High LatitudesClimatological Trend Final Warming Composite Derived from unfiltered daily data (Units: m/s)
Composite Anomaly Evolution: Zonal-mean Zonal Wind • Pressure-latitude • plotting domain • Purple line: Position • of Tropopause • Longitudinal-mean • anomalies plotted • Evolution plotted with • respect to SFW events • (Lag 0) • 10 day low-pass • filter applied
Composite Anomaly Evolution: Zonal-mean Zonal Wind • Day -30: Strong • vertically coherent • westerly signature • Day -10: Westerlies • descend; upper level • easterly anomalies • Day 0: North-South • dipole forms; easterly • wind anomalies dive • into troposphere • Day +10: Strat signal • weakens; Trop signal • attains peak values
Composite Circulation Anomaly Change: Zonal-mean Zonal Wind SFW Change (w/confidence levels) Local zonal wind reductions > 50% Canonical NAM structure* Note structural distinctions *Thompson and Wallace 2001
Composite Evolution: High Latitude Zonal WindZonal Wind Anomalies Total Zonal Wind Field Derived from unfiltered daily data (Units: m/s)
Composite Evolution: 1000 hPa Height AnomaliesPre-SFW Structure Post-SFW Structure
Composite Circulation Anomaly Change: 1000 hPa Geopotential Height (m) -> Near Polar Z increases -> Regionally localized mid-latitude decreases Canonical NAM structure Note structural distinctions
Composite Evolution: High Latitude DynamicsZonal Wind Anomalies Upward E-P Flux/Driving Units: m/s Wave Driving Units: m/s/day
High Latitude Precursor: Zonal-Mean StructureZonal Wind Anomalies Day -30 Anomaly Structure Unfiltered (Units: m/s) Low-Pass Filtered
High Latitude Precursor: Event IdentificationProject Daily Anomalies on Day -30 Precursor Structure Red Line: Composite first annual crossing of +1.5σ in precursor index Blue Line: Composite first annual peak above +1.5σ in precursor index Multi-year index composite based upon 24 precursor episodes
High Latitude Precursor: Composite [U’] EvolutionSFW Composite Precursor-Based Composite Day 0: SFW Onset (Units: m/s) Day -30: Precursor Onset
Composite Dynamical Evolution:Total Zonal Wind EP Flux Anomalies
Composite Dynamical Evolution:Total Zonal Wind EP Flux Anomalies
Composite Evolution: High Latitude Zonal WindZonal Wind Anomalies Tropospheric Deceleration Day -10 to 0 Units: m/s Day +4 to +9
Composite Dynamical Evolution: Days -10 to 0Zonal Wind Tendency E-P Flux/Wave Driving Units: m/s/day Wave Driving Units: m/s/day
Composite Dynamical Evolution: Days -10 to 0[U’] Tendency Total Invert Strat PV Change Units: m/s/day Units: m/s/day
Composite Dynamical Evolution: Days +4 to +9Zonal Wind Tendency E-P Flux/Wave Driving Units: m/s/day Wave Driving Units: m/s/day
Composite Dynamical Evolution: Days +4 to +9[U’] Tendency Total Invert Strat PV Change Units: m/s/day Units: m/s/day
Summary: Structural Evolution • SFW events provide a strong organizing influence upon the large-scale circulation of the stratosphere and troposphere • Enhanced (weakened) polar vortex before (after) SFW events => Reflects more rapid breakup of the stratospheric polar vortex than indicated by the climatological trend • Robust tropospheric flow changes extending down to surface => “NAO/AO-like” phase transition near Earth’s surface • But… Important structural distinctions from canonical NAM => SFW events linked to a distinct class of annular variability? (potentially missed if searching for NAM) David Houghton Symposium 04/01/2006
Summary: Dynamical Evolution • Apparent stratospheric “preconditioning” ~ Day -30 => strengthening and polar shift of polar vortex • Distinct stratospheric decelerations dynamically driven by anomalous upward flux of (planetary scale) Rossby wave activity emanating from tropospheric altitudes • Concomitant and time-lagged tropospheric decelerations => Initial “direct” response? Subsequently indirect? • TEM dynamics dominated by low frequency, planetary scale waves dynamics in stratosphere and troposphere • Robust bi-directional dynamical coupling between stratosphere and troposphere during SFW events David Houghton Symposium 04/01/2006
Implications • SFW events provide new phenomenological paradigm for studying stratosphere-troposphere dynamical coupling • A better understanding & simulation of SFW events may provide an avenue for enhancing medium range forecast skill during spring onset (e.g., via improved representation of the coupled troposphere-stratosphere system) • Long-term trends in annual strength and persistence of the wintertime stratospheric polar vortex may have important unanticipated consequences for extratropical climate David Houghton Symposium 04/01/2006
Composite Anomaly Evolution: 1000 hPa Z • Northern Hemisphere • polar stereographic • Plot longitudinally • varying anomaly field • Evolution plotted with • respect to SFW events • (Lag 0)
Composite Anomaly Evolution: 1000 hPa Z • Day -20: Anomalous • Low Z @ high lats; • High Z @ mid lats; • Positive “NAO-like” • Day -10/0: Pattern • weakens & opposite • phase emerges • Day +5/+10: Opposite • phase pattern reaches • peak magnitudes • Day +10/+20: • Slow weakening
Composite Anomaly Evolution: 50 hPa Z (Stratosphere) • Northern Hemisphere • polar stereographic • (note orientation) • Plot longitudinally • varying anomaly field • Evolution plotted with • respect to SFW events • (Lag 0)
Composite Anomaly Evolution: 50 hPa Z (Stratosphere) • Day -20: Anomalous • Low Z surrounds NP • Day -10: Evolves • into dipole anomaly • (wavenumber 1) • Day 0: Dipole moves • High Z envelops NP; • Low Z shifts south • Day 5: Longitudinally • symmetric N-S dipole • forms; weakens after • ~1.5 σ change in Z
Composite Evolution: High Latitude DynamicsQGPV Anomalies QGPV Tendency Units: 10-6 s-1 Units: 10-6 s-1 day-1