Download
1 / 30
310 likes | 326 Views
R for Statistics and Graphics. Session 2 R for Descriptive Statistics. Mehmet Tevfik DORAK, MD PhD School of Life Sciences, Pharmacy & Chemistry Kingston University London. Istanbul University, Capa Faculty of Medicine 19 April 2019. Introduction to the Crash Course. WEB-BASED SOURCES.

E N D
R for Statistics and Graphics Session 2 R for Descriptive Statistics Mehmet Tevfik DORAK, MD PhD School of Life Sciences, Pharmacy & Chemistry Kingston University London Istanbul University, Capa Faculty of Medicine 19 April 2019
Introduction to the Crash Course WEB-BASED SOURCES http://www.dorak.info/mtd/glosstat.html R Tutorials @ ListenData: https://www.listendata.com/p/r-programming-tutorials.html
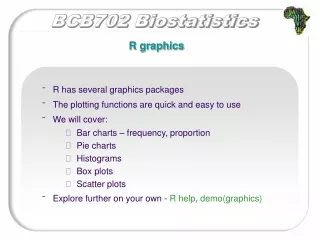
Descriptive Statistics Visual Exploration • Enter your vector name or a column of a dataset (as dataset$column) within the brackets: • hist() # like: hist(iris$Sepal.Width, col = "darkblue") • plot() # like: plot(iris$Sepal.Width, col = "darkblue") • boxplot() # like: boxplot(iris$Sepal.Width, col = "darkblue") • Try the following: • boxplot(iris$Sepal.Length, iris$Sepal.Width, iris$Petal.Length, iris$Petal.Width) • boxplot(iris[-5]) • boxplot(iris[-5], col = "red") • boxplot(iris$Sepal.Width, col="orchid2", pch=24, main="My First Boxplot", • col.axis="blue", col.lab="red", col.main="darkblue", boxwex =0.2) • # Repeat the last command by changing the numbers for pch (plot symbol) and boxwex (box • width expansion) • boxplot(iris$Sepal.Width ~ iris$Species, col = "orchid2", border = "red") • # OR: boxplot(iris$Sepal.Width ~ iris$Species, col = "azure", border = "blue") • abline(h = 3.1, col = "blue") • More variations in the script "s2.R" Script: s2.R
Descriptive Statistics Visual Exploration • Function arguments for base R plots: • Many of the basic plotting commands in base R will accept the same options to control axis limits, labeling, print a title, change the plotting symbol, change the size of the plotting symbols and text, and change the line types. Use them inside the parentheses of a plotting command to have their effect. • main = "Eureka" # add a title above the graph • pch = 16 # set plot symbol to a filled circle • color = "red" # set the item colour • xlim = c(-10,10) # set limits of the x-axis (horizontal axis) • ylim = c(0,100) # set limits of the y-axis (vertical axis) • lty = 2 # set line type to dashed • las = 2 # rotate axis labels to be perpendicular to axis • cex = 1.5 # magnify the plotting symbols 1.5-fold • cex.lab = 1.5 # magnify the axis labels 1.5-fold • cex.axis = 1.3 # magnify the axis annotation 1.3-fold • xlab = "Body size" # label for the x-axis • ylab = "Frequency" # label for the y-axis • Example: • boxplot(iris$Sepal.Width, col="red", pch=24, main="My First Boxplot", col.axis="blue", col.lab="red", col.main="darkblue", boxwex =0.2)
Descriptive Statistics Boxplot # Adding a line to the boxplot: data(iris) boxplot(iris[-5], col="orchid2", border="blue") abline(h = 2.5, col = "red") # OR, all in one line separated by (;): data(iris); boxplot(iris[-5], col="orchid2", border="blue"); abline(h=2.5, col="red")
Descriptive Statistics Boxplot
Descriptive Statistics Statistical Metrics • Enter your vector name or a column of a dataset (as dataset$column) within the brackets: • - mean() • - sd() • - var() • - median() • - mad() # for median absolute deviation from the median (~SD) • - IQR() # for interquartile range (~ SD) • - skew() # for skewness • For kurtosis: • - install.packages("moments"); library("moments"); kurtosis(iris$Sepal.Length)
Descriptive Statistics: psych • install.packages("psych") • library("psych") • a <- c(2,4,3,4,5,6,5,4,5,6,7,4,3,5,4,6,5,7,6,5,4,5,6,7) • describe(a) • After importing an Excel file, try the describe function with a full dataframe (not a vector): • describe(iris[-5]) mad= median absolute deviation (from the median) ~ SD in normally distributed data https://www.statisticshowto.datasciencecentral.com/median-absolute-deviation
Descriptive Statistics: psych describe(iris[-5], IQR = TRUE, quant = c(0.10, 0.25, 0.50, 0.75, 0.90))
Descriptive Statistics: psych describeBy(iris, group = iris$Species)
Descriptive Statistics: fBasics • install.packages("fBasics") • library("fBasics") • a <- c(2,4,3,4,5,6,5,4,5,6,7,4,3,5,4,6,5,7,6,5,4,5,6,7) • basicStats(a) • After importing an Excel file, try thebasicStats() function with a full dataframe (not a vector): • basicStats(iris[-5])
Descriptive Statistics: pastecs • DEFAULTS: stat.desc(x, basic=TRUE, desc=TRUE, norm=FALSE, p=0.95) • install.packages ("pastecs") • library("pastecs") • x <- c(2,4,3,4,5,6,5,4,5,6,7,4,3,5,4,6,5,7,6,5,4,5,6,7) • stat.desc(x) • Try the stat.desc() function with a full dataframe (not a vector): • stat.desc(iris, norm = TRUE) # measures of normal distribution included • Sepal.LengthSepal.WidthPetal.LengthPetal.Width • nbr.val 150.00000000 150.00000000 1.500000e+021.500000e+02 • nbr.null 0.00000000 0.00000000 0.000000e+000.000000e+00 • nbr.na 0.00000000 0.00000000 0.000000e+000.000000e+00 • min 4.30000000 2.00000000 1.000000e+001.000000e-01 • max 7.90000000 4.40000000 6.900000e+002.500000e+00 • range 3.60000000 2.40000000 5.900000e+002.400000e+00 • sum 876.50000000 458.60000000 5.637000e+021.799000e+02 • median 5.80000000 3.00000000 4.350000e+001.300000e+00 • mean 5.84333333 3.05733333 3.758000e+001.199333e+00 • SE.mean 0.06761132 0.03558833 1.441360e-01 6.223645e-02 • CI.mean.0.95 0.13360085 0.07032302 2.848146e-01 1.229800e-01 • var 0.68569351 0.18997942 3.116278e+005.810063e-01 • std.dev 0.82806613 0.43586628 1.765298e+007.622377e-01 • coef.var 0.14171126 0.14256420 4.697441e-01 6.355511e-01 • skewness 0.30864073 0.31261470 -2.694109e-01 -1.009166e-01 • skew.2SE 0.77924478 0.78927812 -6.801988e-01 -2.547904e-01 • kurtosis -0.60581253 0.13870468 -1.416857e+00 -1.358179e+00 • kurt.2SE -0.76961200 0.17620762 -1.799947e+00 -1.725403e+00 • normtest.W 0.97609027 0.98491787 8.762681e-01 9.018349e-01 • normtest.p 0.01018116 0.10115427 7.412263e-10 1.680465e-08
Descriptive Statistics: Hmisc • describe() is a generic method that invokes describe.data.frame(), describe.matrix(), describe.vector(), or describe.formula(). describe.vector() is the basic function for handling a single variable. • install.packages("Hmisc") • library("Hmisc") • x <- c(2,4,3,4,5,6,5,4,5,6,7,4,3,5,4,6,5,7,6,5,4,5,6,7) • describe(x) • Try the describe()function with a full dataframe (not a vector): • describe(iris)
Descriptive Statistics: epiR • library(epiR) • data(iris) • epi.descriptives(iris$Sepal.Length, conf.level = 0.95) • $`arithmetic` • n mean sd q25 q50 q75 lower upper min max na • 1 150 5.843333 0.8280661 5.1 5.8 6.4 5.70974 5.976927 4.3 7.9 0 • $geometric • n mean sd q25 q50 q75 lower upper min max na • 1 150 5.78572 0.1411891 5.1 5.8 6.4 5.655421 5.919022 4.3 7.9 0 • $symmetry • skewness kurtosis • 1 0.3117531 -0.552064
Descriptive Statistics: Histogram and Density Plot Normality checking with histogram and density plot using base R (for vectors) data(iris) hist(iris$Sepal.Width, col = "orchid2", border = "red") windows() d <- density(iris$Sepal.Width); plot(d, col = "blue")
Descriptive Statistics: DataExplorer Normality checking with histograms using the R package "DataExplorer" install.packages("DataExplorer") library("DataExplorer") data(iris) plot_histogram(iris) # Ideal for eye test for normal distribution of all variables in one multipanel graph plot_density(iris) # Ideal for eye test for normal distribution of all variables in one multipanel graph
Descriptive Statistics: Normality Checking Normality checking with histograms and density plots using the R package "DataExplorer" install.packages("DataExplorer") library("DataExplorer") data(iris) plot_histogram(iris) # Ideal for eye test for normal distribution of all variables in one multipanel graph plot_density(iris) # Ideal for eye test for normal distribution of all variables in one multipanel graph ## Can be run like: " plot_histogram(iris); plot_density(iris)" in one line ## You can have the two plots simultaneously on two windows: " plot_histogram(iris); windows(); plot_density(iris)"
Descriptive Statistics: Normality Checking • Simple Fast Exploratory Data Analysis in R with DataExplorer Package • install.packages("DataExplorer") • library("DataExplorer") • data(iris) • plot_str(iris) • plot_missing(iris) • plot_histogram(iris) # Ideal for eye test for normal distribution of all variables in one multipanel graph • plot_density(iris) # Ideal for eye test for normal distribution of all variables in one multipanel graph • plot_correlation(iris) # All pairwise correlations with heatmap • # For options of plot_correlation(), see: https://www.rdocumentation.org/packages/DataExplorer/versions/0.6.0/topics/plot_correlation • plot_bar(iris) # Bar graph for categorical variables • # Next command to create a full report requires "installr" and then installation of "pandoc" with installr: • install.packages("installr") • library("installr") • install.pandoc() • # If successful (may have 32byte - 64byte issues): • create_report(iris) • # Runs all the functions above and creates a full report in HTML format
Descriptive Statistics: Normality Checking • Histogram overlaid with density plot with ggplot2: • install.packages("ggplot2"); library("ggplot2") • ggplot(iris, aes(x=Sepal.Length)) + geom_histogram(aes(y=..density..), colour="red", • fill="orchid2") + geom_density(alpha=0.2, fill="yellow") • # https://www.r-bloggers.com/how-to-make-a-histogram-with-ggplot2 • # http://www.sthda.com/english/wiki/ggplot2-histogram-plot-quick-start-guide-r-software-and-data-visualization
Descriptive Statistics: Normality Checking qqnorm(iris$Sepal.Width, col = "darkblue"); qqline(iris$Sepal.Width, col = "orchid") qqnorm(iris$Petal.Length, col = "darkblue"); qqline(iris$Petal.Length, col = "orchid")
Descriptive Statistics: Normality Checking data(iris) shapiro.test(iris$Sepal.Width) # To run the Shapiro-Wilk test on Sepal.Width > W = 0.98492, p-value = 0.1012 shapiro.test(iris$Petal.Length) # To run the Shapiro-Wilk test on Petal.Length > W = 0.87627, p-value = 7.412e-10
Descriptive Statistics: Normality Checking Simulated data: set.seed(334) # To get the same simulated numbers every time a <- rnorm(100, 30, 5) # To generate a sample of size 25 from a normal distribution with mean 30 and standard deviation 5 shapiro.test(a) # To run the Shapiro test on vector "a" > W = 0.99158, p-value = 0.7899 set.seed(334) b <- runif(100, min = 20, max = 30) # To generate a sample size of 25 random numbers between 20 and 30 shapiro.test(b) # To run the Shapiro-Wilk test on vector "b" > W = 0.94666, p-value = 0.000503
Descriptive Statistics: Normality Checking Kolmogorov-Smirnov Test data(iris) ks.test(iris$Sepal.Width, pnorm, mean(iris$Sepal.Width), sd(iris$Sepal.Width)) # To run the K-S test on Sepal.Width > D = 0.10566, p-value = 0.07023 ks.test(iris$Petal.Length, pnorm, mean(iris$ Petal.Length), sd(iris$ Petal.Length)) # To run the K-S test on Petal.Length > D = 0.19815, p-value = 1.532e-05 • Alternative tests: • The package "nortest" is dedicated entirely to tests for normality. • This package includes: • • Anderson–Darling test (ad.test) • • Cramer–von Mises test (cvm.test) • • Lilliefors test (lillie.test) • • Pearson chi-squared test for the composite hypothesis of normality (pearson.test) • • Shapiro–Francia test (sf.test)
Notes on Graphics • You can save any graphic you generated by code or by the graphics window menu in multiple formats, including TIFF (you can also copy it to the clipboard) - see the script: "tiff.R" • You can generate two graphics simultaneously on separate windows • You can fit multiple plots in one window to create a multipanel graphic • You can use a wide variety of options or colors for any element of the graphics • For a full list of graphical parameters, see: • https://www.statmethods.net/advgraphs/parameters.html • https://www.statmethods.net/advgraphs/axes.html • R Color Chart: http://www.endmemo.com/program/R/color.php (see next slide) • PCH Symbols Chart: http://www.endmemo.com/program/R/pchsymbols.php (see the one after next slide) • For advanced graphics, you can use lattice (included in base R), or ggplot2(see script s2.Rfor examples) Script: tiff.R
Next R for Inferential Statistics I. Categorical Data Analysis