Download
1 / 84
840 likes | 854 Views
The OptiSage module. Use the OptiSage module for the assessment of Gibbs energy data.

E N D
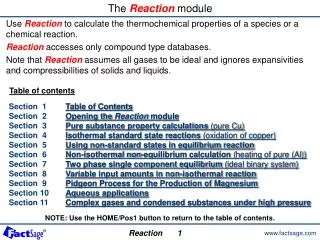
The OptiSage module Use the OptiSage module for the assessment of Gibbs energy data. Various types of experimental data can be utilized in order to generate optimized parameters for the Gibbs energies of stoichiometric compounds as well as the excess coefficients of a wide range of non-ideal solution models. In the present example we will use OptiSage to treat the various phase diagram, enthalpy and activity data for the NaCl-SrCl2 system in order to obtain polynomial parameters for the Gibbs energy of mixing in the liquid phase. Table of contents Section 1 Table of contents Section 2Introduction to the Data Optimization procedure Section 3 Creation of Private Compound and Solution databases Section 4Generation of a ChemSage file for use in OptiSage Section 5 Organization of the experimental data Section 6Execution the OptiSage module Section 7Creation of input from the experimental data Section 8Creation and manipulation of a FactSage optimization file Section 9 Execution of an optimization Section 10 Creation of an optimized Database Section 11 Generation of diagrams for comparison OptiSage 1.1
Introduction to the Data Optimization procedure The OptiSage module is used to generate a consistent set of Gibbs energy parameters from a given set of experimental data using known Gibbs energy data from well established phases of a particular chemical system. Typical experimental data include: • phase diagram data: transitions temperatures and pressures as well as amount and composition of the phases at equilibrium • calorimetric data: enthalpies of formation or phase transformation, enthalpies of mixing, heat contents and heat capacity measurements • partial Gibbs energy data: activities from vapor pressure or EMF measurements • volumetric data: dilatometry, density measurements. The assessor (user of OptiSage) has to use his best judgement on which of the known parameters should remain fixed, which set of parameters need refinement in the optimization and which new parameters have to be introduced, especially when assessing data for non-ideal solutions. OptiSage 2.1
Various experimental data on the binary NaCl-SrCl2 system are available: phase diagram data (liquidus points, eutectic points) liquid-liquid enthalpy of mixing (at 894°C) activity of NaCl(liq) at 3 different temperatures (800°C, 825°C and 850°C) OptiSage will be used to optimize the parameters for the liquid Gibbs energy model (XS terms). All other data (G° of the pure stoichiometric solids, as well as the pure liquid components) will be taken from the FACT database (i.e. remain fixed). A polynomial model for the Gibbs energy of the liquid will be used:G = (X1 G°1 + X2 G°2) + RT(X1 ln X1 + X2 ln X2) + GE where GE = DH – TSEUsing the binary excess terms:DH = X1X2 (A1) + X12X2 (B1)SE = X1X2 (A3) + X12X2 (B3)Hence: GE = X1X2 (A1 - A3T) + X12X2 (B1 - B3T)Where A1, A3, B1 and B3 are the 4 parameters to be optimized. G°2 G°1 G NaCl SrCl2 XSrCl2 Overview of the data to be optimized in the NaCl-SrCl2 system OptiSage 2.2
The 3 Steps in the Optimization Procedure In general a three step procedure is adopted for the optimization: Step 1. Set a thermodynamic datafile (ChemSage file) Step 2. Organise the various experimental data values (Excel file) Step 3. Execute the optimization program interactively (run OptiSage) In order to create a ChemSage file (step 1.), it is necessary to use the Compound, Solution and Equilib modules as outlined in the following slides. OptiSage 2.3
Creation of a private (r/w) compound database • OptiSage uses a ChemSage thermodynamic datafile containing all known and unknown (to be optimized) model parameters. The ChemSage file is created by Equilib. • G° of each component of the liquid phase is taken from the FACT database. • You have to create a private r/w (read/write) COMPOUND database containing NaCl(liq) and SrCl2(liq) using the Compound module. Public data (read-only) cannot be used in OptiSage. • To create a private Compound database: see Compound section 3. • To transfer data between databases: see Compound section 11. OptiSage 3.1
Private Compound Database A private Compound database nicknamed USER containing NaCl and SrCl2 should look like: Note: Gaseous NaCl and SrCl2 are not needed in the present example. OptiSage 3.2
Creation of a new solution database • You have to create a private solution file containing all parameters (either known and/or to be optimized) for each solution phase to be optimized. You cannot perform an optimization using a public database (read-only) such as FACT. • The solution file must include all parameters to be optimized (with their coefficients set to zero or to any initial value). • For the NaCl-SrCl2 system: • one phase is to be optimized: the liquid solution. • a polynomial model will be used (see slide 3).4 coefficients are set to zero:i.e. A1 = A3 = B1 = B3 = 0 • A solution database nicknamed SOLUTION has been created using the Solution module. • to create a private solution database: see Solutionsection 5. • Save this solution file. OptiSage 3.3
Private Solution Database In the Solution module, a new private solution database named SOLUTION.dat should look like: Nickname of the liquid solution Name of the liquid solution Polynomial Model Excess parameters (i.e. A1, A3, B1 and B3) are set to 0 OptiSage 3.4
Generation of a ChemSage file The following four slides show how the above Compound and Solution private databases are linked with the Equilibmodule, and how the selection of the relevant phases in Equilib is used to generate the ChemSage file. OptiSage 4.0
Creation of a ChemSage file for the optimization The procedure is: • open the Equilib module • enter the components NaCl and SrCl2 in the Reactants window of Equilib OptiSage 4.1
Adding your private databases to FactSage list of databases Do not forget to add and activate the newly created private databases to the list of databases in the Equilib module (see Equilib Advanced slide 26.3 and Phase Diagram slide 6.1). From the Menu Bar in the Reactants-Equilib window, select: Data Search Make sure that the ELEM compound database is also selected and that the FACT databases are not selected. …and add your read and write (r/w) databases OptiSage 4.2
in the Menu window of Equilib, select all the species and the solutions (including the solution(s) to be optimized) involved in the actual optimization from your USER databases. save a ChemSage (ASCII format *.dat) file.In the menu bar, select File > ChemSage file > Save ChemSage file… Equilib Menu window OptiSage 4.3
Saving a ChemSage File Saving an ASCIIChemSage file (*.dat) under the name :NaCl_SrCl2.dat OptiSage 4.4
Experimental datasets to be used in the optimization Step 2: Organize the experimental data. Various types of experimental data can be used in an optimization. In the present example activity data, enthalpies of mixing and phase diagram data will be employed. Each phase boundary will be treated as a separate dataset. Each datasets will be given the name GROUP#1, #2, …, #5. This leads to five different datasets. The following three slides show how the five different groups are defined. OptiSage 5.0
We want to optimize the experimental data to obtain the model parameters for the NaCl-SrCl2 liquid phase. Data are divided into five different groups where each group corresponds to a specific type of Equilib calculation. Group #1: Activity of NaCl in the liquid phase Experimental conditions: Amount of NaCl in the liquid phase (NaSrCl) Amount of SrCl2 in the liquid phase (NaSrCl) Temperature Pressure Measured variables: Activity of NaCl in the liquid phase (NaSrCl) Selected phases: Liquid phase (NaSrCl) 1 o 0.9 Ostvold(850 C) o 0.8 Egan and Bracker(825 C) o 0.7 Emons et al.(800 C) 0.6 (liquid ref. state) 0.5 0.4 NaCl a 0.3 0.2 0.1 0 0 0.2 0.4 0.6 0.8 1 Mole fraction SrCl 2 Group #1 – Experimental Data Points: Activity Data. OptiSage 5.1
Group #2: Enthalpy of mixing of the NaCl-SrCl2 liquid mixture at 1167K (894°C). Experimental conditions: Amount of NaCl(liquid) Amount of SrCl2(liquid) Initial Temperature Initial Pressure Final Temperature Final Pressure Measured variables: Enthalpy of mixing (liquid) Selected phases: Liquid phase (NaSrCl) 0 -0.25 Enthalpy of mixing (kJ/mol) o -0.5 Exp. Points of Ostvold (894 C) -0.75 -1 0 0.2 0.4 0.6 0.8 1 Mole fraction SrCl 2 Group #2 – Heat of mixing data OptiSage 5.2
Group #3: Eutectic temperature Experimental conditions: Amount of NaCl in the liquid phase (NaSrCl) Amount of SrCl2 in the liquid phase (NaSrCl) Pressure Measured variables: Temperature(Formation Target on NaSrCl) Selected phases: Liquid phase (NaSrCl) NaCl(s) SrCl2(s1) Group #4: NaCl liquidus data Experimental conditions: Amount of NaCl(s) Amount of SrCl2(s1) Pressure Measured variables: Temperature(Formation Target on NaCl(s)) Selected phases: Liquid phase (NaSrCl) NaCl(s) Group #5: SrCl2 liquidus data Experimental conditions: Amount of NaCl(s) Amount of SrCl2(s1) Pressure Measured variables: Temperature(Precipitation Target on NaSrCl) Selected phases: Liquid phase (NaSrCl) SrCl2(s1) SrCl2(s2) 900 o 874 Scholich Vortisch o 801 800 Bukhalova C) o S2 Liquid o 727 S1 Temperature ( 700 600 o 565 500 0 0.2 0.4 0.6 0.8 1 Mole fraction SrCl2 Groups #3, #4 and #5 – Data related to phase equilibria. OptiSage 5.3
Experimental Data The experimental data are stored in an Excel spreadsheet. OptiSage 5.4
Executing the OptiSage module Step 3. Execute the optimization program interactively. When the thermodynamic datafile (ChemSage file) has been created (Step 1.) and the numerical values of the experimental data to be used in the optimization have been organised into groups (Step 2.), the OptiSage module can be executed and the ChemSage fileloaded. The following two slides show how to initiate OptiSage. OptiSage 6.0
The OptiSage Module • After creating : • a compound database • a solution database • a ChemSage file • and organising the experimental data into groups • OptiSage is ready to be employed OptiSage 6.1
Open a new optimization. • Select File > New from the Menu bar or click on from the toolbar to open a New optimization. OptiSage main window: New optimization • Then open your ChemSage file by selecting: • File > Open ChemSage File from the Menu bar, or • Thermodynamic File from the treeview and double-click to select an input ChemSage thermodynamic file. OptiSage 6.2
Creating OptiSage input for the experimental data The thermodynamic data of the system are already stored since the thermodynamic datafile also contains the names of the phases and their constituents. The following eight slides show how the data for experimental Group#1, Activities of the components in the liquid phase at a given temperature, are entered into the calculation. NOTE: For all experimental input, there is a distinction made between the experimental conditions and the measured variables. In the present case, activities have been measured as function of temperature and composition. Thus temperature and composition (as well as total pressure) are experimental conditions and the measured activities are the measured variables. Different parts of the input window are used for these different data. OptiSage 7.0
Open the ChemSage file previously created. At this point, the OptiSage window shows the tree view (fully expanded) and we are ready to enter the experimental data that will be used in the optimization. Importing the data into Group #1 A right-click on Experimental Data opens the pop-up menu. Select <Add> to open the ‘Add Group’ window. OptiSage 7.1
The Add Group window «initial conditions» are only checked when DH, DG, DV, DS or DCp are calculated. (ex: adiabatic T, DHmix, etc…) Enter the description of group #1: Activity of NaCl in the liquid phase Select units A right-click in each spreadsheet opens a pop-up menu where you can add, edit, delete, load from a file, save to a file either the Experimental Conditionsor the Measured Variable(s) OptiSage 7.2
Adding new Experimental Conditions • Group #1: Activity of NaCl in the liquid phase • Experimental conditions: • Amount of NaCl in the liquid phase (NaSrCl) • Amount of SrCl2 in the liquid phase (NaSrCl) • Temperature • Pressure • Measured variables: • Activity of NaCl in the liquid phase (NaSrCl) • Selected phases: • Liquid phase (NaSrCl) • Right-click in the Experimental Conditions spreadsheet and select Add variable… from the pop-up menu or click on the button in the menu bar to open the Add Experimental Conditions window. • Enter an experimental condition. For example, temperature, on a linear scaleX. • Click OK. • Repeat for the 3 other experimental conditions. OptiSage 7.3
The «Add Experimental Condition» Window Note: Choosing the experimental conditionsis equivalent to entering reactants and fixing final conditions in Equilib. List of the experimental conditions you can declare. List of scales available List of the phases available (when the option is enabled) List of the phase constituents available when needed. List ofstreams(max. 20)Enabled when the «initial conditions» checkbox in the unit frame of the Add Group window is checked and needed when there’s any difference between the initial and the final conditions OptiSage 7.4
Adding the 3 other experimental conditions of Group #1 Changing UnitsPressures are in bar and your data are in atm. Select the appropriate unit. OptiSage 7.5
Adding new Measured Variables • Group #1: Activity of NaCl in the liquid phase • Experimental conditions: • Amount of NaCl in the liquid phase (NaSrCl) • Amount of SrCl2 in the liquid phase (NaSrCl) • Temperature • Pressure • Measured variables: • Activity of NaCl in the liquid phase (NaSrCl) • Selected phases: • Liquid phase (NaSrCl) OptiSage 7.6
Adding a Measured Variable • Right-click in the Measured Variable(s) spreadsheet and select Add variable… from the pop-up menu or click on the button in the menu bar to open the Add Measured Variable window. • Enter a measured variable. • Here, the activity of NaCl in theNaSrCl phase on a linear scaleX. • Click OK. • Repeat for the other measuredvariablesif necessary. OptiSage 7.7
The «Add Measured Variable» Window List of the measured variables you can declare. List of scales available List of the phases available (when the option is enabled) List of the phase constituents available when needed. More are available for aqueous systems. The Target frame is enabled if the final T (P or <A>) is not specified. See slide 7.22. OptiSage 7.8
The declaration of all variables is completed.The «Add Group» window should look like: Group #1: declaration of variables • Each Measured Variables declaration creates 2 columns: • One for the data • One for the estimated error (positive absolute value) OptiSage 7.9
You can enter your data manually or, if your data are in a spreadsheet, copy and paste them in the «Add Group» window. Import the data into Group #1 • Copy of 2 colums of data in EXCEL • Right-click in the first cell in OptiSage to select Paste. Experimental or estimated error should be entered to be considered in the optimization. If a cell is blank or has a value of zero the corresponding data will be ignored. OptiSage 7.10
Group #1, Selection of the phases • Experimental conditions: • Amount of NaCl in the liquid phase (NaSrCl) • Amount of SrCl2 in the liquid phase (NaSrCl) • Temperature • Pressure • Measured variables: • Activity of NaCl in the liquid phase (NaSrCl) • Selected phases: • Liquid phase (NaSrCl) By default, all phases are eliminated • To select a phase: • Click on a phase in the Eliminated frame and • Drag it in the Entered(Stable) frame This is equivalent to species selection in Equilib OptiSage 7.11
Saving experimental data and closing Group #1 To save data and return to the OptiSage main window, select File > Save and close To select or unselect all points, use Edit > Select (or Unselect) all points Warning: Reset will clear all the entries in the Add Group #1 window To format the experimental data spreadsheet cells, use the pop-up menu (right-click in the spreadsheet) OptiSage 7.12
Importing the data into Group #2 Group #2: Enthalpy of mixing of the NaCl-SrCl2 liquid mixture at 1167K (894°C). A right-click on Experimental Data opens the pop-up menu. Select <Add> to open the ‘Add Group’ window. OptiSage 7.13
Enthalpy of mixing of the NaCl-SrCl2 liquid mixture at 1167K (894°C) Experimental conditions: Amount of NaCl(liquid) Amount of SrCl2(liquid) Initial Temperature Initial Pressure Final Temperature Final Pressure Measured variables: Enthalpy of mixing (liquid) Selected phases: Liquid phase (NaSrCl) stream 1NaCl (liquid)T1P1 stream 2SrCl2 (liquid)T2P2 0 Mixture of NaCl-SrCl2 (liquid)TPDHmix -0.25 Enthalpy of mixing (kJ/mol) o -0.5 Exp. Points of Ostvold (894 C) -0.75 -1 0 0.2 0.4 0.6 0.8 1 Mole fraction SrCl 2 Group #2: Heat of mixing data Initial conditions Final conditions Here,P=P1=P2=1 atmT=T1=T2=1167 K OptiSage 7.14
Group #2: Declaration of Experimental Conditions • Enter a group description • Select the units • Check the initial conditions • DeclareallExperimental Conditions [ Initial conditions ] [ T1 ] [T2 ] [ P1] [P2 ] Amount of NaCl(liquid) Amount of SrCl2(liquid) (Final conditions) (T) (P) OptiSage 7.15
stream 1NaCl (liquid)T1P1 stream 2SrCl2 (liquid)T2P2 Mixture of NaCl-SrCl2 (liquid)TPDHmix Group #2: Declaration of the Measured Variable • Experimental conditions: • Amount of NaCl(liquid) • Amount of SrCl2(liquid) • Initial Temperature • Initial Pressure • Final Temperature • Final Pressure • Measured variables: • Enthalpy of mixing (liquid) • Selected phases: • Liquid phase (NaSrCl) OptiSage 7.16
Group #2: Summary of the variables When the declaration of all variables is finished, the «Add Group #2» window should look like: ° Please see slide 7.15 for the complete declaration of Experimental Conditions OptiSage 7.17
Import the data into Group #2 Finally, save data and return to the OptiSage main window, select File > Save and close All points selected Phase selection: Drag and drop from Dormant OptiSage 7.18
Importing data into Group #3 Group #3: Eutectic Temperature A right-click on Experimental Data opens the pop-up menu. Select <Add> to open the ‘Add Group’ window. OptiSage 7.19
Experimental conditions: Amount of NaCl(liquid) Amount of SrCl2(liquid) Pressure Measured variables: Temperature(Formation Target on NaSrCl) Selected phases: Liquid phase (NaSrCl) NaCl(s) SrCl2(s1) 900 o 874 Scholich Vortisch o 801 800 Bukhalova C) o S2 Liquid o 727 S1 Temperature ( 700 600 o 565 500 0 0.2 0.4 0.6 0.8 1 Mole fraction SrCl2 Group #3: Eutectic Temperature OptiSage 7.20
Declaration and input of the Experimental Conditions Group’s name entered, units selected Experimental Conditions variables and data entered We will select a formation target of the liquid phase for the eutectic temperaturemeasurements OptiSage 7.21
Measured variable: formation and precipitation target features The Target frame is enabled because the final T is not specified. • Select the target type: • Formation Target: The program calculates when this phase first forms (activity = 1, and normally zero mass). Note that one of T, P or alpha (<A>) must not be specified (i.e. blank) so that OptiSage can calculate the limiting T (P or <A>) when the formation target phase first forms. The formation target phase may be a compound species (for example a pure solid or liquid) or a solution phase (gas phase or real solution). (See also Equilib Advanced slides 3.1 to 3.6). • Precipitation Target: The program calculates when a second phase first starts to precipitate (activity = 1, zero mass) from this target solution phase (activity = 1, 100% mass). Note that one of T, P or alpha (<A>) must not be specified (i.e. blank) so that OptiSagecan calculate the limiting T (P or <A>) when the second phase precipitates. The precipitate target phase must be a solution phase. (See also Equilib Advanced slides 3.7 to 3.11). • Select the target phase • Press OK. OptiSage 7.22
Declaration and input of Measured Variable,phases’ selection • Finally, save data and return to the OptiSage main window, select File > Save and close • Select the phases • Enter the data for the measured variables OptiSage 7.23
Importing the data into Group #4 Group #4: NaCl Liquidus Data A right-click on Experimental Data opens the pop-up menu. Select <Add> to open the ‘Add Group’ window. OptiSage 7.24
900 o 874 Scholich Vortisch o 801 800 Bukhalova C) o S2 Liquid o 727 S1 Temperature ( 700 600 o 565 500 0 0.2 0.4 0.6 0.8 1 Mole fraction SrCl2 Group #4: NaCl Liquidus Data • Experimental conditions: • Amount of NaCl(s) • Amount of SrCl2(s1) • Pressure • Measured variables: • Temperature(Formation Target on NaCl(s)) • Selected phases: • Liquid phase (NaSrCl) • NaCl(s) OptiSage 7.25
Metastable Phases (Filling the Add Group #4 window) Do not forget to save your data (select File > Save and close) Dormant or Metastable phases OptiSage 7.26
Importing the data into Group #5 Group #5: SrCl2 Liquidus Data A right-click on Experimental Data opens the pop-up menu. Select <Add> to open the ‘Add Group’ window. OptiSage 7.27
900 o 874 Scholich Vortisch o 801 800 Bukhalova C) o S2 Liquid o 727 S1 Temperature ( 700 600 o 565 500 0 0.2 0.4 0.6 0.8 1 Mole fraction SrCl2 Group #5: SrCl2 liquidus data • Experimental conditions: • Amount of NaCl(s) • Amount of SrCl2(s1) • Pressure • Measured variables: • Temperature(Precipitation Target on NaSrCl) • Selected phases: • Liquid phase (NaSrCl) • SrCl2(s1) • SrCl2(s2) OptiSage 7.28


![Wrangling the [Biblio] Module](https://cdn1.slideserve.com/2444107/wrangling-the-biblio-module-dt.jpg)