Download
1 / 40
400 likes | 562 Views
Social Inclusion Policies for BB Access. Stories from South Asia. Brasilia, Brazil November 16 2009. Agenda. e-Sri Lanka: the ultimate social-inclusion program What happened while the government was planning and implementing e-SL Role of Universal Service Policies Conclusions.

E N D
Social Inclusion Policies for BB Access Stories from South Asia Brasilia, Brazil November 16 2009
Agenda • e-Sri Lanka: the ultimate social-inclusion program • What happened while the government was planning and implementing e-SL • Role of Universal Service Policies • Conclusions
e-Sri Lanka: a comprehensive e-development plan. Driven by the Executive. Centrally planned • USD 83 million funding • IDA, Korea, GoSL • “smart island, smart people” • 2003 onwards • Well rounded: • Access • Demand • Enabling infrastructure ICT POLICY, LEADERSHIP, INSTITUTIONAL DEVELOPMENT E-GOVERNMNET PRIVATE SECTOR & HRD DEV. FUND E-SOCIETAL APPLICATIONS FUND INFORMATION INFRASTRUCTURE (rural telecom (fiber) networks, telecenters/kiosks, fonts
E-leadership and Policy: developing the regulatory framework for ICT-inclusion and adoption • Legal instruments and related implementation • E-Transaction law • Data protection act • Intellectual property rights related rules, laws • Cyber crime • Etc. • Partially done (e.g. e-transactions legislation passed).
E-Government: prioritized by impact, reach, feasibility • Focus on G2G, G2B and G2C • Many “foundation” projects: e.g. citizen registry, govt. data network, data centers • Significant re-engineering of processes prior to automation • Computer + BB Connection: channel to reach citizens • Telecenters (kiosks) for the poor • Computer and internet @ home or @ work for rich/middle-class • Today: only one (the Government Information Center) fully implemented • Everything else delayed, but under implementation
Development of the IT/ITeS sector in Sri Lanka. Key driver of BB demand • Government leading the strategy, creating a focus : • Identifying core competencies (highest # of Charted Accountants per capita outside of EU) • Focus on high-value added Accounting & Fin. Services • Positioning Sri Lanka as back-up to India • Industry (& country) promotion, market creation • At the right trade shows, road shows in countries • Ad campaign. Coordinating with other govt agencies • Workforce develoment • Grants for demand-driven activities (private sector demanded) • E.g. for training, for developing industry-wide applications etc.
Results: IT/ITES: 5th Highest Export Revenue Earner in 2007 (2nd in services) 3 b CV USD millions 1 b 546 m 410 m 213 m 135 m 108 m 80 m 47 m IT/BPO-estimate Gem & Jewelry Ceramics Coir Spice Tourism Rubber Tea Apparel 6
IT & ITES Industry Growth 2006 to 2007 213 Million US$ 23% 173 Million US$ ITES ITES US$ Millions INDUSTRY GREW AT 23% FROM 2006 TO 2007 IT IT 7 Source: EDB Export Value Survey 2007
Employment creation from IT and ITES industries in Sri Lanka Total IT industry, including exports, employed 11,564 (2005) 13,870 (2006) 70,000 est. (2014) Estimated that each direct job generates 3-4 indirect jobs: 35,000 indirect (2005) 52,000 indirect (2006) 210,000 indirect (2014) Export-only employment estimated to be 8,400 in 2007 ITES employment was estimated to be 3,700 in 2005, with 30% growth expected in 2006-07
When conditions in Sri Lanka were so similar to Bangalore/Hyderabad, why did IT & ITES sector take off only after e Sri Lanka? Key actions were Liberalizing international gateway (1 33 licenses; price competition) to allow IT and ITES industry redundancy of suppliers and media plus low prices and high quality Attracting a marquee captive BPO, HSBS Group Service Centre, to serve as the answer to the question “can BPOs work in Sri Lanka?”
8 HSBC Group Service Centers in India: Bangalore (2); Hyderabad (2); Kolkata (2); 1 each in Vizag & Gurgaon Wanted to reduce dependency on India, but insisted on an alternative to SLT; Closed only in 2004 as a result of liberalization. HSBC came and went in 2002 and 2003. Now connected through SLT and Tata (VSNL).
Access: 500+ telecenters in rural areas. Delivery channel for e-Gov, other applications • Local entrepreneur awarded contract • Technical support/training by established larger firm • Subsidized capital + declining subsidy for connectivity • Location: near a school, close to a fixed market • not near established internet café; villages under 5,000 ppl • Voucher scheme to stimulate demand among the young • non-market distorting (price changes based on local price for internet access) • Politicization, significant changes to structure • Entrepreneu model eliminated; free services; next to existing • Roughly 6 or so sustainable/with best practices
Infrastructure: 2 fiber optic rings in previously unconnected areas • To previously unserved areas • Telecenters + government offices as anchor clients to guarantee sustainability • Least-cost subsidy scheme to award contract • Winner also given license + CDMA frequency to operate access network • Results: • Existing operators take the govt to court. • Auctions never happen
Other elements, taking a life of their own • Incredibly vibrant blogsphere • In local language • Digital content • E.g. for education • Local Language Fonts • Many years in committees by govt. • Yet commercial fonts developed and working • ICT in education: formally introduced as a subject
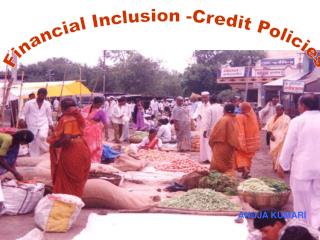
Access to basic voice services even to those at the Bottom of the Pyramid (BOP) in Asia Used a phone in the last 3 months • Sample of over 11,000 BOP (SEC D and E) citizens. Indian sample size over 3,500.
Ownership is less impressive, but high… • Most choose to own a phone (rather than use others’ phones) for convenience; cost is secondary
…and growing. Highest growth in India 131% increase
Lowest Total Cost of Ownership in the world in South Asia Four S Asian countries in less-than-USD 5 TCO club among 77 emerging economies (average TCO = USD10.88)
Regulation isn't great – but necessary condition (market entry) satisfied by regulator • Large number of licenses • Not necessarily transparently granted Perfect Competition
And barriers to entry/ownership eliminated high investment • China Mobile acquired 100% of Paktel • Orascom increased stake in Mobilink to 100% • SingTel purchased 30% Warid Telecom • OmanTel purchased 60% of World Call
Result: high growth, driven by high level of competition Source: ITU, data as of end 2008
EBITDA margins v. high previously (50%+). Now more in line with EU/USA. But still attractive
Helped by budget telecom model that is characterized by… • Low ARPU’s • Average ~USD 5 (Bangladesh USD 2 for some operators) • Mostly (over 80%) prepaid • low cost of serving (no bills, electronic re-load, minimal 1-800 customer care) • low customer acquisition cost (~USD 3.5) • low/no credit risk (pre-paid and cash) • Regional negotiations for equipment; managed networks; • Low(er) Quality necessary feature in early stages • “acceptable” call drop rates x2 of US/EU • Leapfrogging: Install newer (cheaper) technologies without legacy investment issues
Budget telecom model: now being applied to data • Through mobile devices: NOT computers • Growth from limited-download, pre-paid packages • Scratch cards or e-loading for top ups and • Highest sale of SIMs = “data only” SIMs in India • Quality: lower than expected • 20% of what’s promised when going to international site • 80% of what’s promised when accessing in-country content • International bandwidth still a problem
Even in the absence of 3G/“real-mobile BB” speeds, appetite for Mobile BB is high, and growing 1:19 ratio in favor of mobile
Even e-Gov happening via mobiles now. And not just for information provision, but for payments • Zero-Mass Foundation and State Government Partnership • Equipment: • Mobile phone • with near field communication • + finger print scanner • + script printer • Money box • INR 22,000 • Compared to IN 1,400,000 for a kiosk
Around 1.6 million pensioners (in 9,200 villages, 127 districts) receive payments this way • No “leaking” of pension • Ghost pensioners (15 – 20%) • % kept by govt. official (about INR 20 – 50 out of every INR 400 payment each month) • True Mobility (Disabled pension payments) • Real financial inclusion eventually • Here and now • Instead of waiting for the 100,000 planned kiosks (only 40,000 implemented so far • How to cover a total 600,000+ Indian villages with kiosks? • Possible because mobile network has extended to rural India • Deregulation, competition
It's easy to get USO wrong. E.g. India • USO policy (then) • Charge 5% of gross revenues from operators • Funds given to installing rural FIXED PHONEs • Mobile not eligible for USF (conditions of auctions) • But rural fixed penetration negligible (even declining recently) • But only mobile penetration growing rurally (without any help) • By 2006, India has USD 4 billion in a undisbursed USF • Just second to Brazil!?
Stakeholder unhappiness as revealed by LIRNEasia's TRE survey TRE scores for Universal Service Obligation - 2006 IN: Lowest in both fixed and mobile
USO Policy changed in March 2007 • Mobiles made eligible to receive USO funds • Perceptions improve (TRE jumps 64%) • BUT, still ~4 billion undisbursed • TRE Scores barely above average of 3.0 • No subsidies needed? • Passive infrastructure auctions 64% increase 36% increase
Similar examples elsewhere • Philippines • 1 fixed line for every 10 mobiles: condition of license • Unused “installed” vs. “subscribed” fixed lines • Nepal • Good least-cost subsidy auctions for backbone • But toothless regulator winner unable to interconnect • Increase in price, not decrease • India • Large amounts of un-lit fiber owned by incumbent • But USO not invested here • Sri Lanka • No USO, but high penetration & low prices (through competition)
Telecom is KEY • Low cost (retail and whole-sale) is a MUST • High competition and high investment is the necessary condition • The role of government as catalysis not to be underestimated (e.g. e-SL) • Even if it’s just talk, with a little bit of funding (e.g. digital Bangladesh) • Not just demand, but supply • De-regulation can change the supply of BB • But demand driven by content, applications • USO: ok, but not in absence of weak regulation • Often substitutable by competition • USO a blunt tool. Competition a more optimal solution
About LIRNEasia • “To improve the lives of the people of the emerging Asia-Pacific by facilitating their use of ICTs and related infrastructures; by catalyzing the reform of laws, policies and regulations to enable those uses through the conduct of policy-relevant research, training and advocacy with emphasis on building in-situ expertise”