Download
1 / 57
600 likes | 787 Views
Statistical Basis for Quality by Design. Lynn Torbeck Evanston, IL. Overview. Evolution of QbD Statistical basis for QbD Controlled Experiments Cause and Effect Design Space Three case studies Modeling. “The only thing new in the world may be the history we don’t know.”

E N D
Statistical Basis forQuality by Design Lynn Torbeck Evanston, IL
Overview • Evolution of QbD • Statistical basis for QbD • Controlled Experiments • Cause and Effect • Design Space • Three case studies • Modeling
“The only thing new in the world may be the history we don’t know.” • “All models are incorrect, but some are useful.” G. E. P. Box
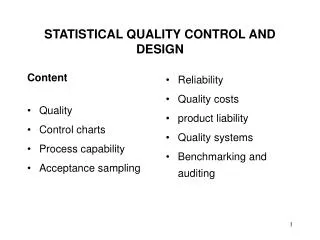
Getting to Quality by Design • Quality Control • Quality Assurance • Statistical Quality Control • Statistical Process Control • Quality by Design
Quality Control • Def #1: Sampling or 100% inspection, test and accept, reject, rework or scrap. The focus is on the product after is has been made. No statistics. • Def #2: The technical activities of a quality department working with other departments to achieve quality. No statistics.
Quality Assurance • Management activities needed to run a quality control department and provide oversight. This includes organization, planning, policies, procedures, documentation, training, suppliers and working with other departments. • No statistics
Statistical Quality Control • Specific statistical techniques used for end product quality control including probability, basic statistics, sampling plans, statistical metrology, repeatability and reproducibility studies, as well as tabulating and reporting defects, rejects and costs. • A passive descriptive approach.
Statistical Process Control • Specific statistical techniques used to monitor, improve and control the manufacturing process itself. These include probability, basic statistics, graphics, statistical control charts, process capability studies and designed experiments for improvement and optimization. • An active approach for the process
Quality by Design • A broad life-cycle approach to development that uses statistics but is not limited to statistics. Statistical techniques include, basic statistics, inferential statistics, graphics, experimental design and statistical model building using contour plots and response surfaces. An active approach to product and process development.
Statistical Basis for QbD • Correct data collection • Define the reportable result or value • Find summary statistics, average, S • Do controlled experiments • Develop mathematical models • Infer to the larger population • Maintain control of the product / process
Controlled Experiments • Success / Failure • One-Factor-at-a-Time • Multiple-Factors-at-a-Time, DOE • Full Factorials • Fractional Factorials • Plackett – Burman designs • Central Composite designs
The Genius • Sir Ronald A. Fisher • Born 1890 • Died 1962 • Graduated college in 1913, math, genetics • 1919 joined Rothamsted Experimental Station in Harpenden, England • The right person in the right place.
In The Beginning • 1926, “The Arrangements of Field Experiments.” Journal of the Ministry of Agriculture of Great Britain. Fisher. • 1935, The Design of Experiments, Oliver & Boyd, London. Fisher. • 1946, “The Design of Optimum Multifactor Experiments,” Plackett and Burman.
More Beginning • 1951, “On the Experimental Attainment of Optimum Conditions,” Box and Wilson. • “… determining optimum conditions in chemical investigations, …” • Finding the effect of quantitative factors on a measured response. • Thus, factor space and response space.
Industrial Applications • 1954, The Design and Analysis of Industrial Experiments, Davies, editor. • “In this field [chemical industries] statistical methods have a major contribution to make to industrial research, because the use of such methods enables clear and unambiguous conclusions to be drawn from the minimum number of experiments and therefore for the minimum cost.”
“The Book” on DOE • 1978, Statistics for Experimenters, Box, Hunter and Hunter. • This is the text that popularized DOE. • “Scientific research is a process of guided learning. The object of statistical methods is to make that process as efficient as possible.”
“If the experimental design is poorly chosen, so that the resultant data do not contain much information, not much can be extracted, no matter how thorough or sophisticated the analysis. On the other hand, if the experimental design is wisely chosen, a great deal of information in readily extractable form is usually available, and no elaborate analysis may be necessary. In fact, in many happy situations all the important conclusions are evident from visual examination of the data.”
Basic Science Cause Effect ?
Terminology - Cause • Causes = • Input variables = “X” variables • Independent Variables = • Factors = Factor Space • Critical Parameters for materials, processes and products or CP
Terminology - Effect • Effects = • Output variables = “Y” variables • Dependent Variables = • Responses = Response Space • Critical Quality Attributes for processes and products or CQAs
FACTOR SPACE N dimension X’s X1 X2 X3 X4 X5 XN RESPONSE SPACE M dimension Y’s Y1 Y2 Y3 Y4 Y5 YM Design Space
Design space Dependent Response Space Independent Factor Space f(x)=? “Linkage”
More Terminology • Univariable = One variable at a time • Multivariable = More than one variable • Empirical #1 = Not using DOE, Trial/Error • Empirical #2 = DOE & generic equations • Systematic = DOE & generic equations • Mechanistic = DOE and theory equation E=MC2
Perturbation Study of Dissolution Apparatus Variables • Eaton, J.; Deng, G. and Hauck, W., et all. • Dissolution Technologies, February 2007 • USP dissolution apparatus 2 • USP Prednisone Reference tablets • Response is mean percent dissolved & S • 9 variables, each at two levels. • A 46 run resolution V design was used.
Nine Multifactor Variables • Temperature • Shaft wobble • Rotation speed • Vessel centering • Vessel tilt • Paddle height • Base plate levelness • Vessel types • Level of deaeration
What They Found • For the mean percent dissolved • Three statistically significant variables: • Level of deaeration • Vessel type • Rotation speed
Designing in a Vacuum • James Dyson of Dyson Ltd. • Invented the Dyson vacuum cleaner • Experimented with cardboard and tape • “I made hundreds of cyclones, then thousands of them.” • Hand built 5,127 prototypes • He claims using the “Edisonian” process
Prototyping • “When you develop a prototype, you have to change one thing at a time. If you make several changes simultaneously, how do you know which change has improved the object and which hasn’t?” • “You have to be very patient, testing and retesting and building a series of results.” • United’s Hemispheres Magazine, November 2005, p86
1954 Example • Box, G. E. P. “The Exploration and Exploitation of Response Surfaces,” Biometrics, 10, 16, 1954 • “The object of this paper is to discuss and to illustrate with examples certain ideas which have arisen from the [prior] work and which it is believed may be of value in a wider field than that of chemical research.”
Model Evaluation • Coefficient of Determination • R Squared or R2 • The percent of variability in the data that is explained by the proposed model equation. • R2 ranges from zero to one hundred % • R2 needs to be large, say greater than 90% and preferably 95% to 99%.
Robustness • “… a measure of its capacity to remain unaffected by small but deliberate variations in method parameters and provides an indication of its reliability during normal usage.” • Reliability is consistency over time • “The evaluation of robustness should be considered during the development phase.”
Ruggedness • “… the degree of reproducibility of test results obtained by the analysis of the same samples under a variety of normal test conditions …” • See Torbeck, L. “Ruggedness and Robustness with Designed Experiments,” Pharmaceutical Technology, March 1996.
Flat Line Variables • “An input variable or process parameter need not be included in the design space if it has no effect on delivering CQAs when the input variable or parameter is varied over the full potential range of operation.” • A graph would show a flat horizontal line • Changing X has no effect on the value of Y
Mechanistic Models • Box, G. E. P. and Youle, P. V. • “Exploration and Exploitation of Response Surfaces. An Example of the Link Between the Fitted Surface and the Basic Mechanism of the System.” • Biometric, 1955
“Mechanistic Understanding” • “The present article shows how study of the form of the empirical surface can throw important light on the basic mechanism operating and can thus make possible developments in the fundamental theory of a process.”
A Theoretical Surface • “A theoretical surface, based on reaction kinetics is now derived, rate constants are estimated from the data and the theoretical surface is compared with the empirical surface previously obtained.” • Called Mechanistic Model Building.
Process Reengineering • Also called Reverse Quality by Design • Work on an existing or legacy product • Use historical and validation data • Use designed experiments to find the cause and effect relationships between the process parameters, factors, and the quality attributes, the responses.
Chemometrics • From Wikipedia, the free encyclopedia • Chemometrics is the application of mathematical or statistical methods to chemical data. The International Chemometrics Society (ICS) offers the following definition: • Chemometrics is the science of relating measurements made on a chemical system or process to the state of the system via application of mathematical or statistical methods. • Chemometric research spans a wide area of different methods which can be applied in chemistry. There are techniques for collecting good data (optimization of experimental parameters, design of experiments, calibration, signal processing) and for getting information from these data.
Chemometrics’ Tools • Multivariate data acquisition • Principal Component Analysis • Classical Least Squares regression analysis • Multiple Linear Regression • Principal components Regression • Partial Lease Squares • Discriminant Analysis
Take Home Points • The statistical basis for QbD was first published in 1951 by Box and Wilson. • Mechanistic model concepts were first published in 1955 by Box and Youle.
A Last Thought • “Statistical thinking will one day be as necessary for efficient citizenship as the ability to read and write.” • H. G. Wells
Historical Articles • 1926, R. Fisher, “The Arrangements of Field Experiments,” J of the Ministry of Agriculture, England, Vol. 33, 1926, pp 503-513. • 1937, F. Yates, “Design and Analysis of Factorial Experiments,” Commonwealth Bureau of Soil Science, Technical Communication No. 35, 1937. • 1946, “The Design of Optimum Multifactorial Experiments,” Biometrika, Vol. 33, 1946, pp 305-325. • 1951, G. Box and K. Wilson, “On the Experimental Attainment of Optimum Conditions,” J of the Royal Statistical Society, Series B, Vol. XII, No. 1, 1951. • 1954, G. Box, “The Exploration and Exploitation of Response Surfaces: Some Considerations and Examples,” Biometrics, 10: 16, 1954. • 1955, G. Box and P. Youle, “The Exploration and Exploitation of Response Surfaces: An Example of the Link Between the Fitted Surface and the Basic Mechanism of the System,” Biometrics, Vol. 11, pp 287-323, 1955. • 1957, G. Box and S. Hunter, “Multi-Factor Experimental Designs for Exploring Response Surfaces,” Ann Math Statistics, 28, pp 195-241.